Previous Analysis: Successful Bullish Breakout In our previous analysis, we identified a Falling Wedge pattern accompanied by bullish divergence, forecasting a breakout above 147.807. The price hit our target, confirming the bullish momentum and reaching key Fibonacci levels. What’s Next: Upon analyzing the chart, we observe that price has found support at...
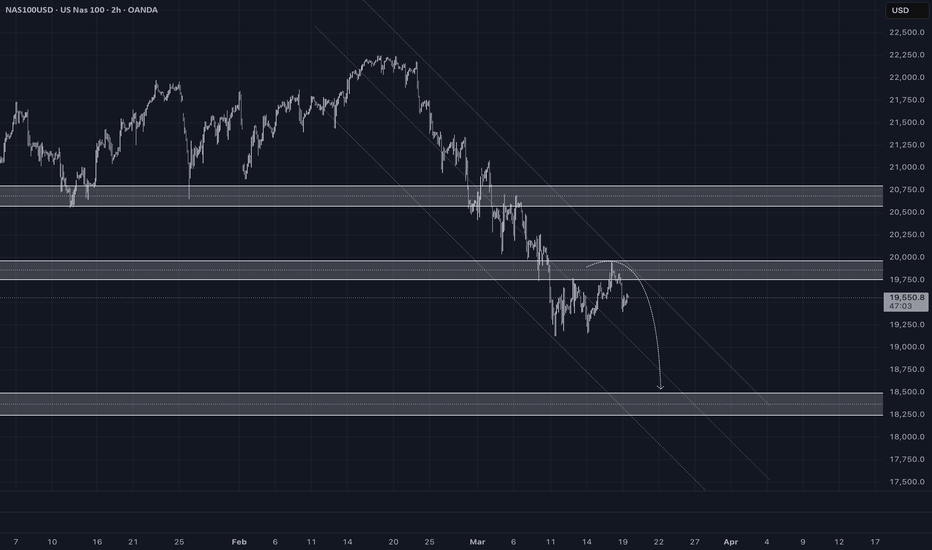
After analysing the US100 chart, the index has been trading within a downtrend channel since Friday, February 21, 2025. After dropping to 19,131, it attempted a recovery but faced strong resistance at 19,957, leading to a decline. As the saying goes, “ Follow the trend—the trend is your friend. ” Given the ongoing downtrend, US100 may continue to decline toward...
After analyzing the chart across multiple timeframes, we have identified a Falling Wedge pattern, signaling a potential bullish breakout. Additionally, bullish divergence is visible on most timeframes, reinforcing the likelihood of upward momentum. Currently, the price is trading above a strong support level at 146.213, indicating a solid base. Our nearest...
In our previous analysis, we anticipated a price drop—and it played out perfectly, securing 10,315.6 pips in profit. What’s Next? Now, after analyzing multiple timeframes, we see that the price has bounced off the 2nd large channel’s middle line, a key support level respected multiple times in the past. Currently, it’s trading around 2915.44, near our...
This checklist is designed to help you perform a thorough analysis of the market to make informed trading decisions. It encompasses a range of technical and fundamental questions that should be considered before entering a trade. Market Overview and Direction 1. What is the overall direction of the market? 2. What are the directions of various market...
After analyzing multiple timeframes, we can see that the price started trading within a large channel from Friday, 15th March 2024. The channel’s upper boundary acted as a strong resistance on Thursday, 31st October 2024, at 2790. Both the upper and lower boundaries of the channel have consistently functioned as key support and resistance levels. The price...
After analyzing multiple timeframes, we observe that the price has surged significantly and is now trading within a key resistance zone. The resistance remains strong, and the RSI across multiple timeframes is in the extreme overbought territory, showing bearish divergences. Additionally, despite the sharp rally, the price has not undergone any meaningful...
After a strong breakout from a falling wedge and handle pattern on Wednesday, Nov 6, 2024, price surged to an All-Time High of 109,358.01. However, a retracement followed, with the formation of a double top pattern leading to a breakdown below the neckline at 91,809.11, sending prices tumbling to 78,167.81, perfectly aligning with the golden ratio (50% Fibonacci...
COINBASE:BTCUSD - Daily Current Price: 97,520 Executive Summary: Is Bitcoin Set for a Correction After Hitting $104,000? Bitcoin has hit significant milestones, with two of our predicted targets—$90,000 and $100,000—successfully achieved, delivering a remarkable gain of 46.44% and 3,307,221 pips. After climbing to $104,000, Bitcoin entered extreme...
After analyzing multiple charts, the USDJPY chart reveals a potential correction as the price encounters resistance at a broken weekly trendline, now serving as a key supply zone. The steep uptrend appears overextended, increasing the likelihood of a retracement as the market consolidates gains. A breakdown of the rising support trendline could signal a shift...
Everything is outlined on the chart to keep it as simple as possible.
Everything is outlined on the chart to keep it as simple as possible.
The price is approaching the resistance zone at 2721.148, a level previously tested and rejected. A bearish pullback from this area could drive the price toward the support at 2649.948. If momentum builds further, the next target could be around 2591.581. Watch closely for confirmation near the resistance before making any decisions. Trade smart and stay sharp,...
Price rejected from 158.409, forming a potential downward setup. The target near the 151.746 support, the risk-to-reward ratio is favorable at 3.15. Confirmation of bearish momentum may drive price toward the lower support, aligning with the RSI showing a loss of bullish strength. Keep an eye on the 156.108 support as an intermediate level before the final...
After analyzing multiple timeframes, we can see that the price managed to rise to 150.738 on Friday, 21st of February. However, after encountering resistance, it reversed and broke the support level at 149.568. Additionally, the price has been trading within a channel since Monday, 23rd of December 2024, consistently respecting the lower boundary of the channel...
Everything is outlined on the chart to keep it as simple as possible.
Gold (XAU/USD) shows strong bearish momentum across multiple timeframes, with the price consistently trading below key SMAs, reinforcing downward pressure. The rejection from the $2,640 resistance zone and the descending trendline aligns with the bearish continuation pattern within the ascending channel. A confirmed breakout below the channel’s lower boundary...
OANDA:XAUUSD - Daily Gold’s Bullish Breakout Shines Bright! Gold (XAU/USD) has confirmed a strong breakout from a Falling Wedge and Rounding Bottom, rebounding off the 50% Fibonacci level (2,533.75). With the next target at the 161.8% extension (3,107.09), this setup offers a potential 16.49% gain in just 77 days. Ideal for position traders seeking long-term...


