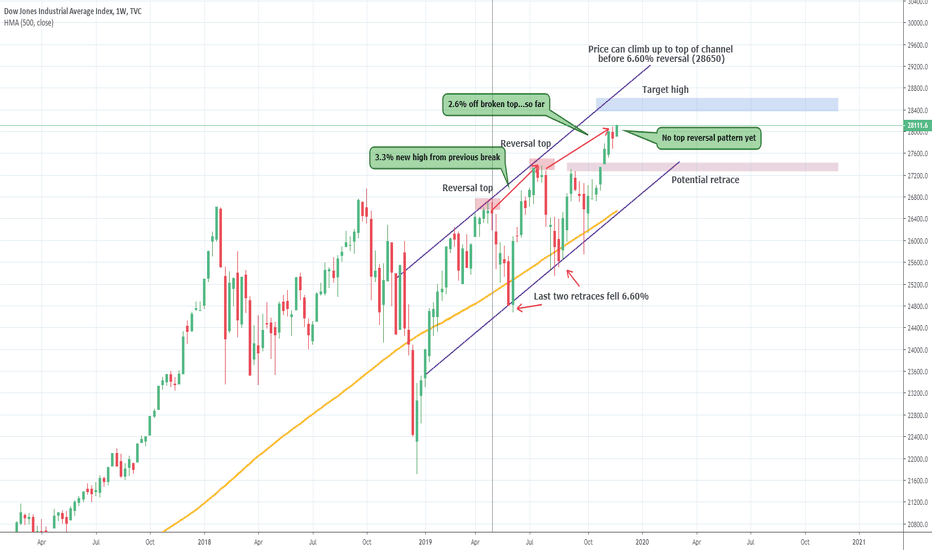
The Dow Jones Industrial Average is still looking like a strong bull on the weekly timeframe. The candles have not yet formed a reversal pattern, there is still potential for the upside after breaking the previous top. On a weekly candle once a pin bar formation of a strong reversal Doji forms then we can talk about the potential downside. For now, the target is...
Gold has been an interesting asset over the past few weeks, and one thing is for sure a long term down channel is forming, however, how will we get to $1420 no one knows. Currently, we were a little more on the short side based on the number of dojis that formed around $1475-78, but it was evident we would be encountered with the support at $1445 from the long...
Bitcoin hit a strong level of support being the 50% Fib extension level before the buyers came in on a long wick. Looking at this chart on a daily, smaller swing idea we can see the bear structure forming well for another push lower, which can happen after a rebound. One concerning piece of information is that volume to the swing higher was pretty strong, it has...
On an overall trend, TSLA has been forming lower highs if you extend the view on a weekly chart. The new low at $360 based on the previous high on a larger timeframe suggests another impulse move lower. The pop above $300 was due to the earnings report that managed to beat finally on a positive note which got investors extremely excited. We suspect some more...
Over the last 14-weeks, Apple stock has had 2 red weeks, and they've been almost negligible. The stock is up nearly 80% this year alone!! We can see the stock gain 100% by the end of the year if this continues, especially around the holiday season. Since Apple is on all-time highs, the only instrument to help us with the potential upside target is the Fib...
Over the past few weeks, oil was making some gains slowly to push up from the lower $50.00 level and nearly into $60.00. There was some technical stagnation just under $59.00. A triple top had formed and we were waiting to see if support would hold for a push through resistance into $60.00, then the news came out from OPEC and OPEC+ that brought a strong 5% drop...
Amazon stock has been on the rise for the past few days on strong volume through some key resistance points, one being the year to date POC. The upside structure is starting to build up as well, as the low that caused the move higher was higher than the previous drop. The volume on the recent pop shows promise to the upside. There is a resistance point that is...
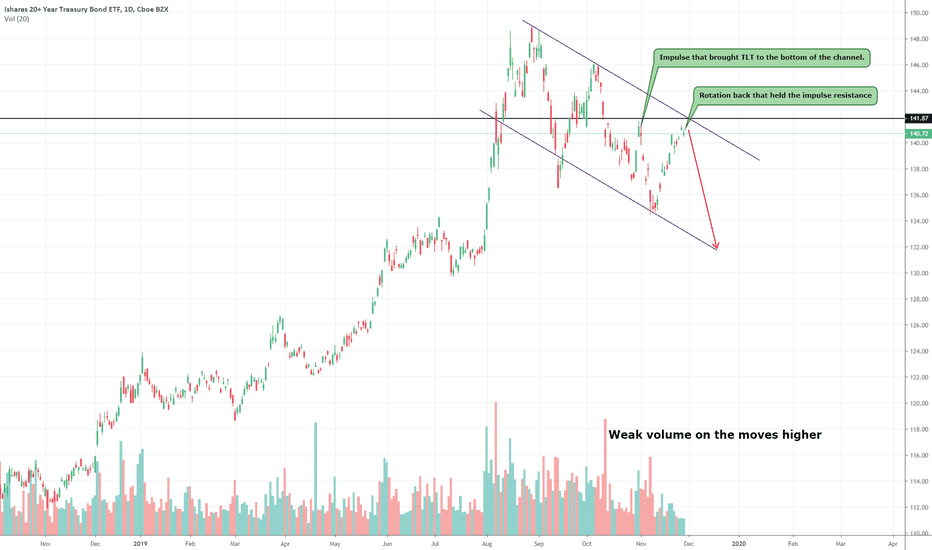
TLT is a 20+ year bond ETF that made strong highs throughout the rate-cutting cycle and rightfully so. The inversion of bonds vs the equity market has caused bond yields to drop and because of that since the price of bonds is directly inversely correlated to their yields, prices in TLT and other bonds have been increasing. The low rates have come to a halt as the...
Investors and traders alike are looking at this thing and getting frustrated if they haven't been able to catch any of this long and no one wants to buy the top with the hopes that the upside will continue. So what is a good entry location for continued longs on the SPY? A preferred retrace is the convergence of multiple things. 1. A retrace that is no more...
The equity markets in the US have been moving really well through highs like its nobody's business, however as they continuously progress the moves get shorter and the pullbacks non-existent. Recent a 1.5-2 year wedge in formation was broken to the upside which indicates a bull trend continuation. Usually, the pop above the broken resistance will revert at least...
Crude oil is still holding upside bull structure and it didn't even have to pull down into the $56.75 where the impulse started, the bottom of the channel at $57.35 held really well for the bulls to continue and the $57.85 held multiple times for the upside on rotations and wicks which indicates more upside. The only part that may break up the upside trend is...
Commodities are feeling the downside pressure due to the strong US dollar, there is money flowing out safe-haven assets into the equity market since it's been climbing to all-time highs. Silver forms a very interesting pattern and has been doing so since the start of September when it fell drastically from the strong rally. The pattern involves a strong 1-2-day...
Really strong resistance looks like it's about to break above 1.335, the move higher into the level started from a higher low on the weekly. There was a wick over the past week that failed at the resistance, however, if we get a candle close on the week and daily above 1.335 we will see more upside based on price action. The targeted move is 1.35 and the broken...
The first red week out of the last 7 weeks, price had rallied over 6% since early October and this is the first sign of a reversal for the continued move. The volume had been weak over the last few weeks on new highs. Price did make a new all-time high this week before reversing on the week. The doji candle that formed at the top of the trend on a weekly chart...
EURUSD has been in a strong bear channel, nearly 2 years straight. A lot of its due to the ECB monetary policy that has an extremely dovish tone, which puts downside pressure on the Euro. On a technical basis on the weekly chart we got a really strong reversal at the top of the channel at 1.117 and a recent broken low that was tested and held really well by the...
The recent upside in the bond market has been in tandem with the upside in the S&P 500. The move higher in bonds is largely due to the lower rates in monetary policy. Which should not directly affect long-term bonds by much but they have had some effect. Over the past three months, Bonds have gone down while the S&P 500 has made a lot of gains. The 30-year bonds...
XRT is the retail ETF and every year we get a burst around the holiday season if you're patient. Over the past three years, starting the beginning of November into December and even through some of January XRT and the Retail sector popped higher off the increased sales through the holiday season. Even last year while we experienced a correction to bear market in...
The Dax has recently played off of our short level the endless rotation at the 13305 was the indication that there is a stall in momentum from the upside. Meaning we could see a retrace. It's not as strong as the US equities due to the European economy, German economy and the monetary policy. We are watching the retrace into the 12880 support as the first pitstop...


