NEAR Protocol / NEARUSD is trading inside a 1 year Channel Down. The price is lately inside a smaller Channel Down that failed today and got rejected on the 1day MA50. The 1day RSI howver has been on a Channel Up in the meantime, which is a huge bullish divergence and resembles the mid September 2024 rejection. That was on the larger scale though a bottom for...
S&P500 / US500 took a big hit today following the higher than expected PCE, causing a price rejection on the 4hour MA50. So far however the drop stopped exactly at the top of the former Channel Down of February-March. With the 4hour RSI on the same level as March 10th, if this level holds, it will be a huge retest buy signal and will start a new bullish...
Bitcoin / BTCUSD found excellent support on the 1week MA50 and is staging a full force recovery. According to the Time Cycles, it sits between the 0.786 and 1.0 Fibonacci levels. That's hostorically the Final Year of the Cycle. All Fib stages have been fairly similar among those Cycles so if it continues to be that consistent, we should expect the price to rise...
Super Micro Computer Inc / SMCI is trading inside a Channel Up. The new bearish wave has already completed a -47% decline, same as the previous one, and the symmetry inside this pattern seems very high. The price is now very close to the Channel's bottom and is technically a strong buy opportunity. We expect a new higher high close to the 1.618 Fibonacci...
Short answer? Yes it is. Ethereum / ETHUSD is trading inside a 7 year Channel Up and lately has found itself under the 0.618 Fibonacci retracement level for the first time since November 2020. This is technically a temporary overreaction like the bullish breakout over the 0.382 Fib in March 2024. Based on the final year rallies inside this Channel Up, we can...
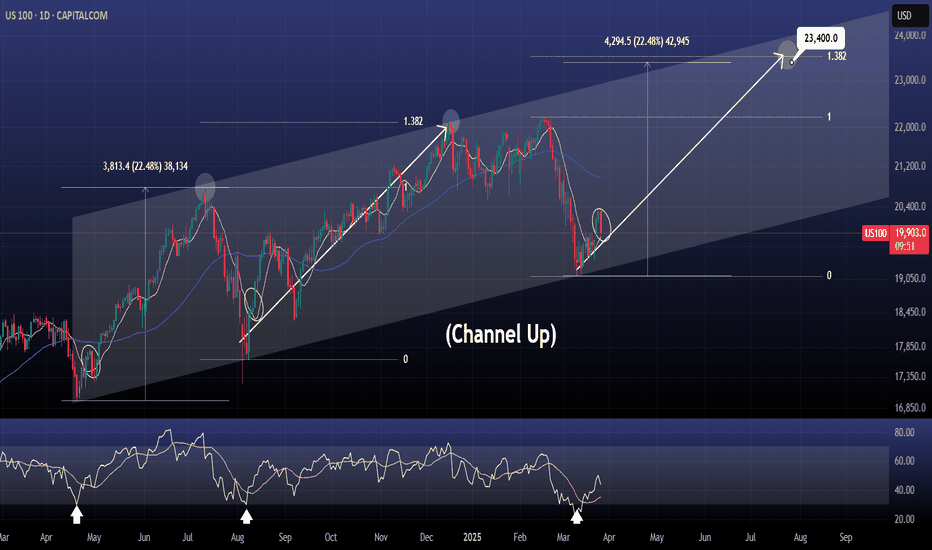
Nasdaq / US100 has just started the new bullish wave of the long term Channel Up. The bottom was made 2 weeks ago and every time the bullish wave crossed over its 4hour MA50, it is expected to make a pullback retest at some point. This pullback is taking place today. Whether it replicates the first bullish wave of the Channel Up or the second, the index aims...
Tesla / TSLA is on the 2nd straight green 1week candle, crossing above the 1week MA50. With the 1week RSI bouncing on the 2 year Rising Support, the Channel Up has technically formed its new bottom. Both the current and the previous one were formed on the 0.618 Fibonacci retracement level after a -55% decline. If the bullish wave is also as similar as the...
Dow Jones / US30 posted the first green weekly candle after hitting last week the 1week MA50. This is obviously a critical support level as it has been holding since the October 30th 2023 rebound. As this chart shows, Dow has been repeating the same patterns, Cycle after Cycle. Right now it has entered the Final Year of Bull, which is the part where it rises...
Bitcoin has often been described as the digital Gold. And with good reason as it posseses the scarcity attribute of Gold like no other asset. More often than not, we've seen Bitcoin replicate Gold's trading pattern and why not, as market psychology under certain set of conditions tend to be similar. What better patterns to repeat than the long term ones. And on...
AMD is trading inside a Channel Down since November 1st 2024 and under a second layer of lower highs since December 4th 2024. Along with the 1day RSI that just crossed above its own Resistance level, the price crossed above that second layer of lower highs. This is the first sign of an upcoming bullish breakout but the last Resistance to confirm that is the 1day...
Aptos / APTUSD is trading inside a Triangle since its very first low historically and the price seems to be stabilizing after February's Low on its bottom. In the meantime, it is double bottoming on the 1.5 year Support Zone with the 1week RSI formation common on all prior bottoms. Buy and target 15.00 (Resistance A). Follow us, like the idea and leave a...
Bitcoin / BTCUSD has found the support it desperately needed on the 1week MA50 and rebounded. Now it faces the most important Resistance of its Cycle, the 1day MA50. Every time this broke in the last 2 years, the market started a strong rally. Buy and target 140000, which would be just under the Pi Cycle Top. Follow us, like the idea and leave a comment below!!
This is the unique ratio of the crypto total market cap excluding the top 10 against Bitcoin. The market is consolidating for 7 straight weeks after rebounding on the top of the former Triangle of the previous Cycle. Basically it this bearish leg is almost identical to October-December 2020. This kickstarted the Altseason of 2021. We expect a similar altcoin...
LINK is trading inside a 2 year Channel Up. The price is under the 1week MA50, which is about to form a Bearish Cross which the 1day MA50. Last time that happened, the bottom came 10 days later. If the waves are symmetric inside this Channel Up, then we're already at or very close to the bottom, given also that the 1day RSI got oversold and this has been an...
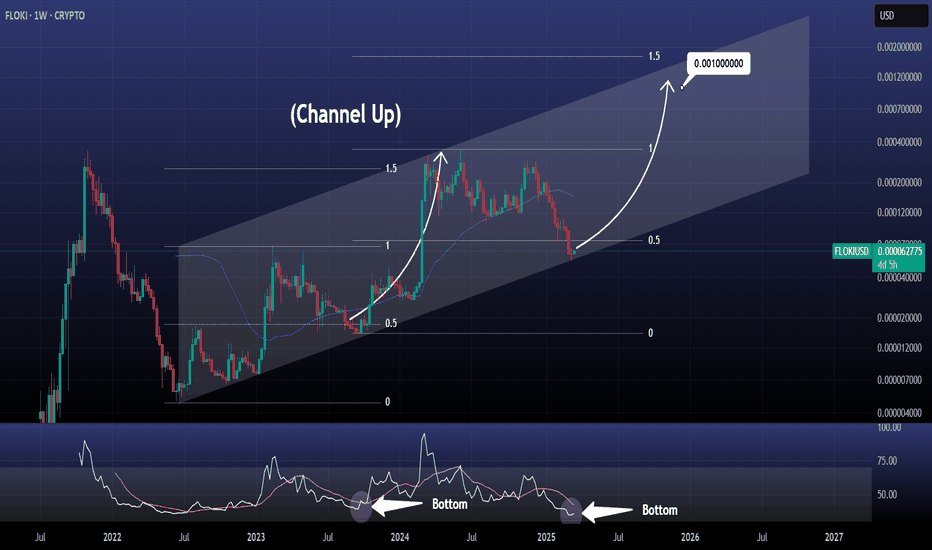
FLOKI is trading inside a Channel Up since the June 13th 2022 Bear Cycle bottom. As the 1week RSI touched 35.00 and is holding, this is technically a strong buy indicator long term. The price just broke below the 0.5 Fibonacci level and touched the bottom of the 3 year Channel Up. There is no better buy signal than this. Buy and target 0.001 (just under the 1.5...
Binance Coin / BNBUSD is trading inside a Cup and Handle pattern for the entirety of its Cycle. Right now it is forming the Handle part with the 1week RSI neutral. Technically that is an ideal long term buy opportunity. Last week could be the bottom and we expect another +98.69% rebound such as on August 5th 2024. Buy and target $1000. Follow us, like the...
Dogecoin / DOGEUSD has hit this month and so far holding its 1month MA50. This Cycle isn't that different from the previous two, although it is naturally a not as aggressive as the market has matured. According to the 1week RSI, the market is at the bottom of the final Bull Cycle pull back before the final rally for the Cycle Top. We expect it to reach at least...
Shiba Inu / SHIBUSD is rebounding at the bottom of the 3.5 year Triangle. The 1week RSI is on a similar sequence as February-May 2023, which eventually rose aggressively by +661.50%. Considering that the price made last week a Double Bottom with the August 5th 2024 low, this is a unique long term buy opportunity. Buy and target 0.00008450 Follow us, like the...


