This 4-hour Bitcoin chart highlights a descending trendline acting as resistance, while an ascending trendline supports the price. The price is consolidating near a key resistance zone Green at $84,705 - $85,556, indicating a potential breakout above the trendline. A successful breakout and retest could lead to a bullish move toward the higher resistance zone Blue...
Crypto Total Market Cap Excluding Top 10 Dominance (%) on a weekly timeframe, showing a long-term downtrend with lower highs. Price is currently testing a strong support zone Green around 8% dominance suggesting a potential reversal. If it successfully bounces from this Green zone, the next key resistance is around 10-11% Blue zone, aligning with the descending...
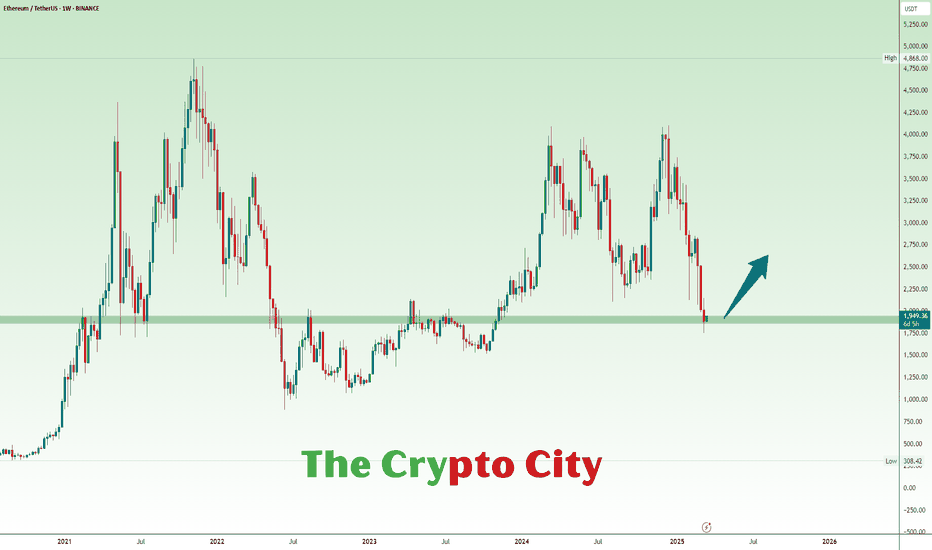
ETH is trading at a key support level, signaling a potential strong rebound. If buyers step in, a sharp upward move could follow.
NEAR is trading below a trendline from December, currently holding within the blue support zone at $2.091–$2.350. A breakout above the trendline and $2.712 resistance could trigger bullish momentum. The key resistance at $3.563, which previously acted as strong support, could pose a challenge. After breaking below, the price consolidated under this level for 28...
A few months ago, the total crypto market cap surged past its previous highs, reaching a new all-time high of $3.7 trillion. The current pullback appears to be a bullish retest of the breakout level, potentially setting the stage for the next upward leg.
Bitcoin dominance ( CRYPTOCAP:BTC.D ) has been stagnant lately, partly due to rising stablecoin dominance. BTC pairs are holding up better than before, hinting at seller exhaustion or a delayed reaction. I believe altcoins will outshine BTC on its next big move; otherwise, both will keep drifting lower.
The CRYPTOCAP:TOTAL Crypto Market Cap dipped below its 2021 highs once more. Last week's candle held, but prices slid lower this week. Watching the weekly close to sustain the high timeframe uptrend.
Bitcoin is currently retesting the upper trendline of a bullish megaphone pattern, a key structure that typically signals strong upside potential after confirmation. If this retest holds as support, BTC could see a major move toward new highs, aligning with the pattern’s bullish continuation. However, losing this level could delay the rally. 📍 Key Level to...
Current Market Overview & Potential Moves Long Wicks: The daily (1D) and weekly (1W) candles are forming long wicks, but these are simply filling previous wicks on their respective timeframes. This means they aren’t valid imbalances that need to be refilled, so they don’t necessarily signal a further downside. CME Gaps: Last weekend’s CME gap was fully closed,...
The good news: The #Bitcoin gap is nearly filled. The bad news: This entire pump-and-dump was just another golden opportunity for the wealthy to profit while everyday investors took the hit once again.
ENJ is currently trading within a Falling Wedge pattern, a bullish reversal setup. It’s holding at the yellow support zone between $0.1258 - $0.1258, a critical level for buyers. If the price bounces from this zone could ignite a strong bullish wave pushing price to the falling wedge upper boundary and the resistance zone Blue at $0.2063 - $0.2365.
EOS is currently shaping a falling wedge pattern, a well-known bullish reversal structure that often precedes high-volatility breakouts. The price action is tightening within this formation, pressing against strong descending resistance, while key support levels remain intact. Bullish Breakout Levels to Watch To confirm a bullish breakout, EOS must pierce...
Bitcoin Trading in a Defined Range For the past 90 days, Bitcoin has been consolidating within a high time-frame (HTF) range of $108,000 to $90,000. Despite ongoing speculation about whether this phase represents distribution or re-accumulation, a decisive breakout in either direction is imminent. Current Price Action and Market Structure At present, Bitcoin...
CRYPTOCAP:BTC is consolidating well above support, with no clear signs of a top. The trend remains upward, and weak altcoin performance doesn’t imply BTC has peaked. Historically, Bitcoin tops when altcoins surge, not struggle.
Altcoin dominance has been declining since early 2024, revisiting June 2023 lows and hitting a 4-year low. This mirrors the last cycle, though the drop then was sharper and faster. In 2021, altcoins surged post-halving as BTC climbed 50-100% above its previous all-time high—similar to what could unfold in 2025. While each cycle differs, the pattern so far loosely...
DOT has been consolidating within a well-defined range between support zone Green a $3.499 - $3.852 and the resistance zone Blue at $10.203 - $11.090 for an extended period. Recently, the price rebounded from the lower boundary of this range, signaling potential upward momentum. If bullish strength persists, in the coming days, DOT is expected to move toward the...
SOL is currently trading within a falling wedge pattern after making a new All-Time High. The price is consolidating between the $189.89 support level and the $207 resistance level. A confirmed breakout above the falling wedge and resistance at $207 could push the price towards the next resistance zone, marked in green, between $218.76 and $223.12. If SOL tests...
NEAR remains strong on the high timeframe after a solid performance last year. On the mid-time frame, it’s still consolidating within the wide $3-$8 range. With liquidity now cleared below, all eyes are on this zone to see if a breakout is coming.


