Per chart, Eth finally broke out of its channel, if the pattern stands then we are looking at high 1700's then minor correction to around 1400, the correction level could change due to new pattern. As you can see the channel lines are all the same so if its a mirrored pattern it should be a fun run. It's a slow climb to 2k but we will get there soon. Trade...
We have been trading sideways for a while but not for long. Blue is the flag based off the high that was hit on the 1 hr The orange is the hourly open price which seems to be capped under the orange line so if the open of an hour is outside of this besides just the high then we will be on our way. The chart shows that the (orange) open line and the (blue) high...
Hit and bounced off the trend line, Stock market is all red people are looking to where they can park money for growth, up or down could depend on the gov's move today. I am positive that we will be going up or sideways. 28,500 is pretty solid resistance for BIT.
As you can see on this chart, there are some major moves mostly the downward spikes that all overlay with the spikes with BIT and XLM on the 15-minute chart. I am posting this because if you are preaching that BIT is going to drop to 20 or 25 then you will probably see a scare sale in these and other coins. Trade smart and buy the dips. My mirrored analysis of...
As you can see on this chart, there are some major moves mostly the downward spikes that all overlay with the spikes with BIT and ETH on the 15-minute chart. I am posting this because if you are preaching that BIT is going to drop to 20 or 25 then you will probably see a scare sale in these and other coins. Trade smart and buy the dips. My mirrored analysis of...
See attached charts for XLM and ETH for mirrored dips and tops
If we can get out of the slump and hit 1170 then I think we are off to the races potentially getting up to 1600 by Feb. I am not investing until we are confirmed out of the downtrend always a good time to buy a little extra at a discount. Trade smart, happy trading.
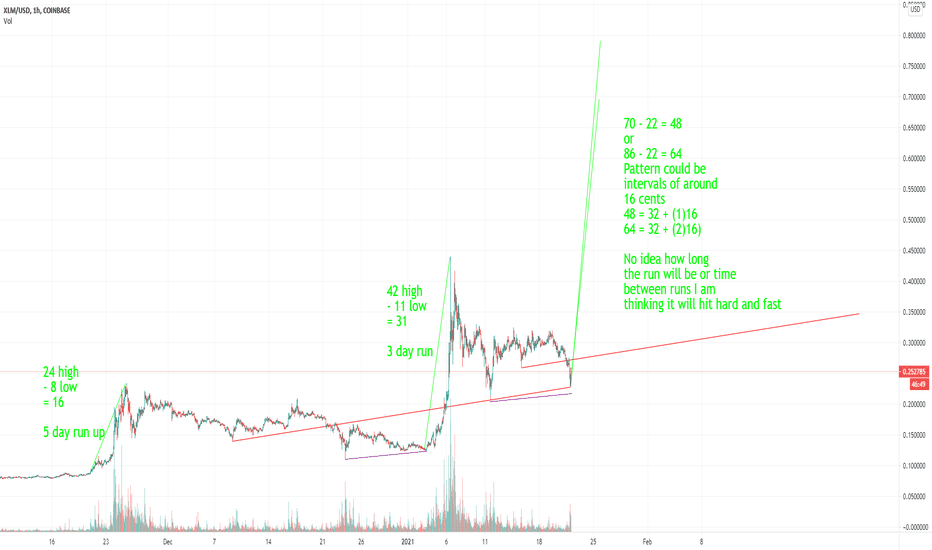
First time posting so don't beat me up too hard, just wanted to post what I saw. There are 3 items on the chart This chart is all on the concept of 22 or 18 being the bottom of the correction. 1. the red line, it appears there is a direct link between the 2 resistance lines measured back to the mid resistance line of the prior run. I have cloned the line and set...


