Amazon (AMZN) almost has been trading within a multi-year Channel Up pattern since the Housing Bubble bottom in November 2008 and this month almost touched its 1M MA50 (blue trend-line). With the exception of the 2008 Housing Crisis and the 2022 Inflation Crisis, which bottomed on the 1M MA100 (green trend-line), the 1M MA50 has never been broken. In fact it has...
WTI Oil (USOIL) has formed an Inverse Head and Shoulders (IH&S) pattern, which is a technical bottom formation that signals the trend change to bullish. So far the move is limited by the 4H MA50 (blue trend-line) which has 2 rejections already and is keeping the bullish break-out from happening. If the market closes a candle above the 4H MA50, we will have a...
The S&P500 index (SPX) is attempting to recover from the April 07 2025 market low, following the 90-day Tariff pause. Last Thursday however it formed a Death Cross on the 1D time-frame, he first since May 11 2022, which was during the last Inflation Crisis correction. That was nothing like the current crash though as it was a technical 1-year Bear Cycle in...
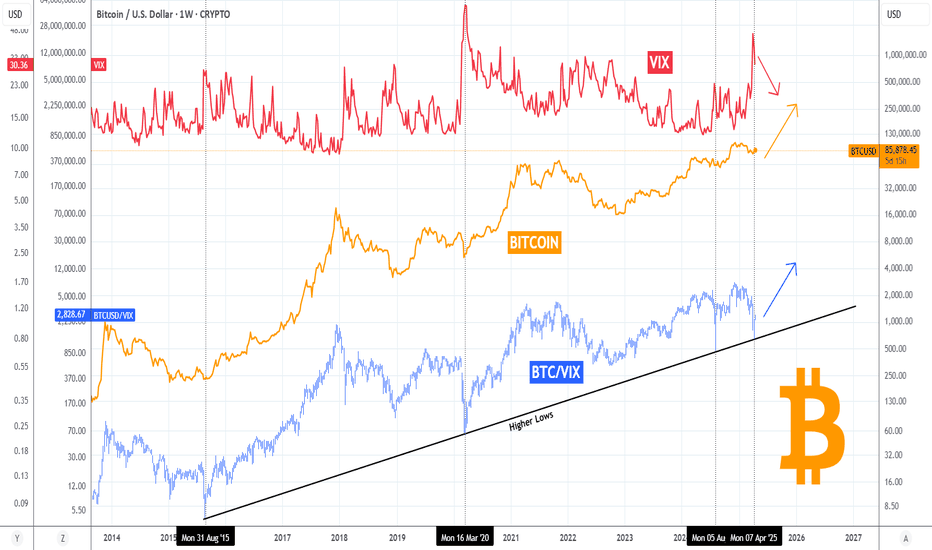
Bitcoin (BTCUSD) is attempting to make yet another green day, yesterday not only did it close above its 1D MA50 again but was also the 4th green day in the last 6. This attempt is showing that the trend is gradually shifting again towards long-term bullish but today we'll present to you another one, this time in relation to the Volatility Index (VIX). BTC's...
Alphabet Inc. (GOOG) almost tested last week its 1W MA200 (orange trend-line). That level has been holding for more than 2 years (since March 13 2023) and it's been the main Support of the Bull Cycle that followed the November 2022 Inflation Crisis bottom. The pattern is almost like the Ascending Triangle that led to the March 2020 COVID crash, which was the...
NASDAQ (NDX) had a massive bullish reversal 1W candle last week as, despite a Lower Low opening, the intra-week rebound surpassed the opening of the previous week. The sell-off reached almost as low as the 1W MA200 (orange trend-line) , which has been the Support level of the late 2022 Inflation Crisis bottom and has been untouched for more than 2 year. This is...
The EURUSD pair got an initial rejection near its 2-month Higher Highs trend-line with the 4H RSI an a Bearish Divergence (Lower Highs) since April 03. The last pull-back was -2.31% and made double contact with the 4H MA50 (blue trend-line) before rebounding. In fact all Higher Highs rejections hit at least he 4H MA50 before rebounding. As a result, we see a...
Gold (XAUUSD) hit the 1-month Higher Highs trend-line and has started to form a short-term Top. The last two short-term High sequences peaked on the 2nd High and pulled-back to at least the 4H MA50 (blue trend-line). The peak formation on the 4H RSI of those two sequences was demonstrated with Lower Highs. Similarly the most optimal short-term buy was when the 4H...
Bitcoin (BTCUSD) closed Saturday's 1D candle above the 1D MA50 (blue trend-line) for the first time in more than 2 months (since February 03)! The 1D MA50 got tested and rejected the price 6 times since then. At the same time, the price marginally broke above the Lower Highs trend-line that started on the January 20 All Time High (ATH). This is the most powerful...
Microsoft (MSFT) has corrected by -26.50% from its All Time High (ATH), representing the 4th biggest correction since June 2010, which was the first pull-ack after the historic 2008 Housing Crisis. At the same time the 1W RSI hit the 30.00 oversold limit for the first time since that low of June 2010! Not even the Housing bottom didn't exhibit such low 1W...
Last time we looked into the GBPJPY pair (March 20, see chart below) we had a sell signal which dully delivered our 188.550 Target: This time we have the price at the bottom (Lower Lows trend-line) of the extended Channel Down, with the 1D RSI almost reaching the 30.00 oversold limit. All such bottoms were followed by a rebound that hit at least the 1D MA50...
The Volatility Index (VIX displayed by the blue trend-line) has entered a level that has visited only another 5 times in the last 27 years (since August 1998)! That is what we've called the 'VIX Max Panic Resistance Zone'. As the name suggests that indicates ultimate panic for the stock markets, which was fueled by massive sell-offs, leading to extreme volatility...
Bitcoin (BTCUSD) seems to be at a point where it last was at the beginning of its current Bull Cycle in October 2022. And that's the point where the Global Liquidity Cycle Indicator (black trend-line) bottomed and started rising, confirming the more on Higher Lows. This huge buy formation has been present on every BTC Cycle, usually at its bottom (but on the 2015...
The USDJPY pair has been trading within a Channel Up since the October 17 2022 High and right now the current 1W candle is very close to its bottom (Higher Lows trend-line). This offers a low risk trading set-up. Confirmed buy will be if the price breaks and closes a 1W candle above the 1W MA50 (blue trend-line), in which case our Target will be July's Resistance...
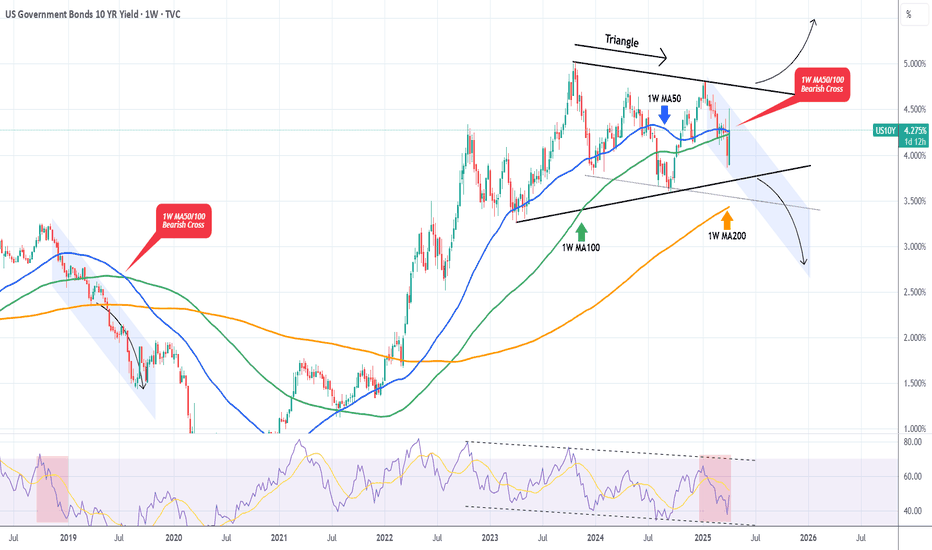
The U.S. Government Bonds 10YR Yield (US10Y) is trading within a 2-year Triangle pattern and following this week's trade events, got back on its 1W MA50 (blue trend-line). A potential break-out either way from this long-term pattern will be massive. We do believe though that there are higher probabilities for a bearish break-out as the 1W MA50 is about to cross...
The S&P500 index (SPX) is making a remarkable comeback following the non-stop sell-off since mid-February as, following the tariff 90-day pause, it is staging a massive rebound just before touching the 1W MA200 (orange trend-line). Since that was almost at the bottom of its bullish channel while the 2W RSI hit its own Higher Lows trend-line, this can technically...
Bitcoin (BTCUSD) made a miraculous comeback yesterday as it rebounded with force almost +12% from its session Low, following the 90-day tariff pause news. This rebounded has been performed on both the 1W MA50 (blue trend-line), which has been the key long-term Support of this Bull Cycle, but also on the previous High line, which is the trend-line coming from the...
WTI Oil (USOIL) has been trading within a long-term Channel Down since the September 25 2023 High and the recent Trade War sell-off helped the price drop towards the pattern's bottom (Lower Lows trend-line) much quicker. Technically this has been a 1W MA50 (blue trend-line) rejection, previously a Lower High rejection on the 1W MA200 (orange trend-line). Notice...


