Microsoft (MSFT) has corrected by -26.50% from its All Time High (ATH), representing the 4th biggest correction since June 2010, which was the first pull-ack after the historic 2008 Housing Crisis. At the same time the 1W RSI hit the 30.00 oversold limit for the first time since that low of June 2010! Not even the Housing bottom didn't exhibit such low 1W...
Last time we looked into the GBPJPY pair (March 20, see chart below) we had a sell signal which dully delivered our 188.550 Target: This time we have the price at the bottom (Lower Lows trend-line) of the extended Channel Down, with the 1D RSI almost reaching the 30.00 oversold limit. All such bottoms were followed by a rebound that hit at least the 1D MA50...
The Volatility Index (VIX displayed by the blue trend-line) has entered a level that has visited only another 5 times in the last 27 years (since August 1998)! That is what we've called the 'VIX Max Panic Resistance Zone'. As the name suggests that indicates ultimate panic for the stock markets, which was fueled by massive sell-offs, leading to extreme volatility...
Bitcoin (BTCUSD) seems to be at a point where it last was at the beginning of its current Bull Cycle in October 2022. And that's the point where the Global Liquidity Cycle Indicator (black trend-line) bottomed and started rising, confirming the more on Higher Lows. This huge buy formation has been present on every BTC Cycle, usually at its bottom (but on the 2015...
The USDJPY pair has been trading within a Channel Up since the October 17 2022 High and right now the current 1W candle is very close to its bottom (Higher Lows trend-line). This offers a low risk trading set-up. Confirmed buy will be if the price breaks and closes a 1W candle above the 1W MA50 (blue trend-line), in which case our Target will be July's Resistance...
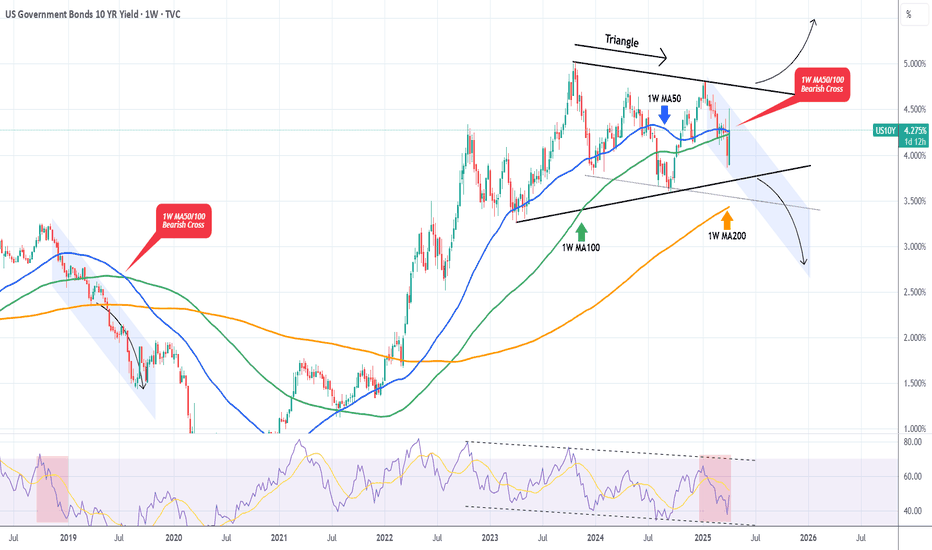
The U.S. Government Bonds 10YR Yield (US10Y) is trading within a 2-year Triangle pattern and following this week's trade events, got back on its 1W MA50 (blue trend-line). A potential break-out either way from this long-term pattern will be massive. We do believe though that there are higher probabilities for a bearish break-out as the 1W MA50 is about to cross...
The S&P500 index (SPX) is making a remarkable comeback following the non-stop sell-off since mid-February as, following the tariff 90-day pause, it is staging a massive rebound just before touching the 1W MA200 (orange trend-line). Since that was almost at the bottom of its bullish channel while the 2W RSI hit its own Higher Lows trend-line, this can technically...
Bitcoin (BTCUSD) made a miraculous comeback yesterday as it rebounded with force almost +12% from its session Low, following the 90-day tariff pause news. This rebounded has been performed on both the 1W MA50 (blue trend-line), which has been the key long-term Support of this Bull Cycle, but also on the previous High line, which is the trend-line coming from the...
WTI Oil (USOIL) has been trading within a long-term Channel Down since the September 25 2023 High and the recent Trade War sell-off helped the price drop towards the pattern's bottom (Lower Lows trend-line) much quicker. Technically this has been a 1W MA50 (blue trend-line) rejection, previously a Lower High rejection on the 1W MA200 (orange trend-line). Notice...
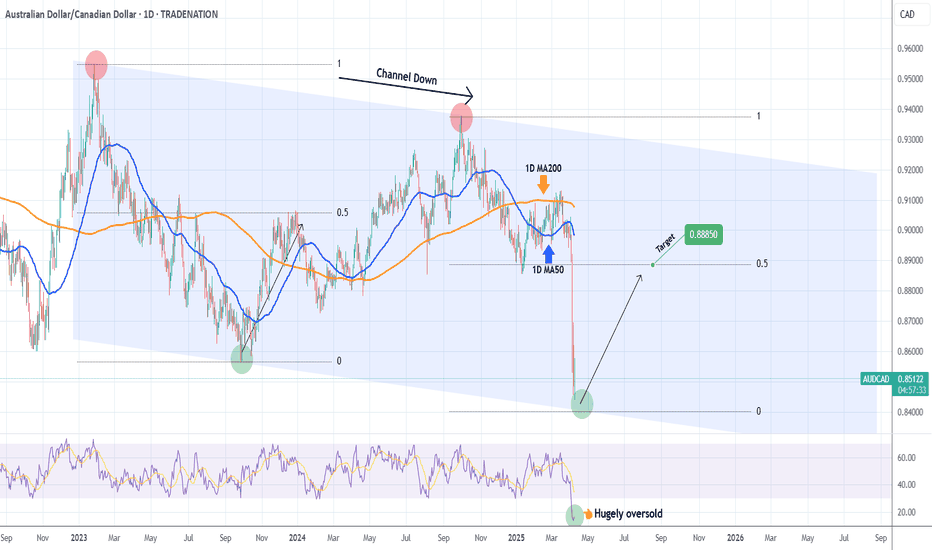
The AUDCAD pair has been trading within a long-term Channel Down since the January 26 2023 High and the recent Trade War fueled sell-off took the price almost on its bottom (Lower Lows trend-line). The 1D RSI got vastly oversold at 14.00 and a bottom is to be expected within the next 2 weeks. Still, this level is low enough to be considered a solid long-term buy...
Back in August 02 2024 (see chart below), we introduced this model on Apple Inc. (AAPL) that had high probabilities of success at predicting Cycle peaks: We may have not hit $280 but $260 is close enough especially if you are a long-term investor that values buying low and selling high. Now that the price has corrected by -35% and just hit the 1M MA50 (blue...
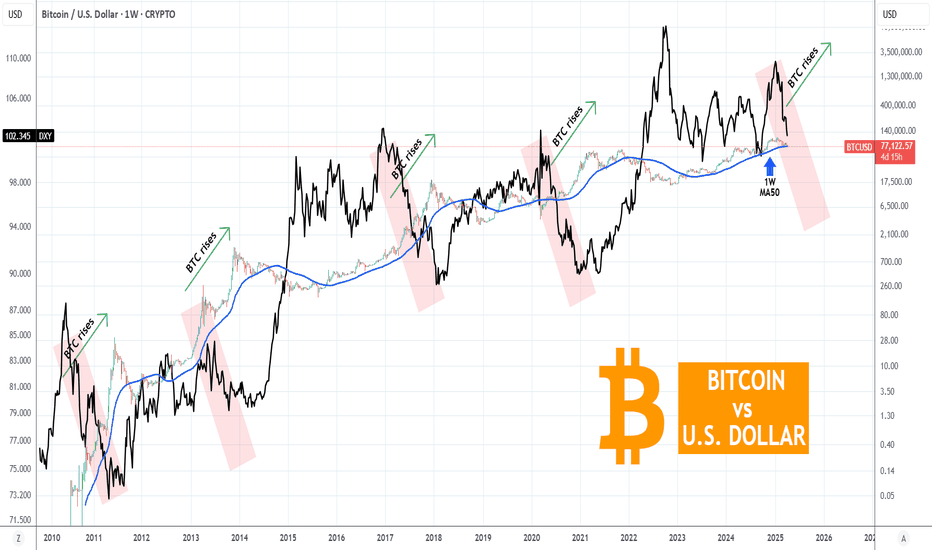
Bitcoin (BTCUSD) is hanging on its 1W MA50 (blue trend-line) amidst the market chaos and especially following last night's stronger 104% trade tariffs to China from the U.S. This is a simple yet powerful classic chart, displaying Bitcoin against the U.S. Dollar Index (DXY, black trend-line). This shows the long-term negatively correlated pattern they follow on...
Dow Jones (DJIA) is almost on its 1W MA200 (orange trend-line) and earlier today President Trump activated 104% duties on Chinese imports. This is far from being an encouraging development especially after Monday's attempt for the market to recover. Most of the gains were lost yesterday and today it is a wait-and-see game in anticipation of the market reaction on...
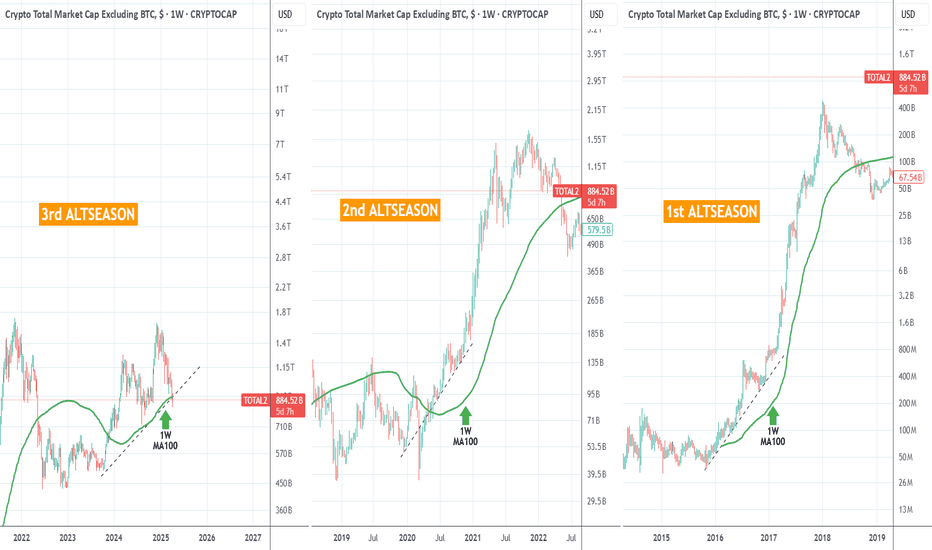
Just some chart fun. Do you think the pattern will be completed and the current altcoin Bull Cycle will follow the previous two? Do you think there will be a new Altseason amidst the tariff chaos? Whatever happens, the 1W MA100 (green trend-line) has to hold (close 1W candles above it) if that would be the case and it just got...
It's been too long since we last looked on the EURCAD pair (November 29 2024, see chart below) but it delivered nonetheless our 1.500 Target: Thit time the price is consolidating after a strong February rally and posts a similar pattern to October 2022 - January 2023. The 1D RSI sequences between those fractals are identical and it is not technically...
Last time we looked at Platinum (XPTUSD) was more than 2 months ago (January 30, see chart below) getting our expected rise and hitting the 999.50 Target: This time the price is at the bottom (Support Zone) of the 11-month Descending Triangle pattern, which is a technical buy opportunity. The last Bullish Leg hit the 0.618 Fibonacci retracement level, while...
NVIDIA Corporation (NVDA) has officially entered Bear Market territory as it has declined by almost -45% from the January 2025 All Time High (ATH) and just hit its 1W MA100 (green trend-line) for the first time since the week of January 30 2023. This is the strongest correction the stock has seen since the 2022 Inflation Crisis and based on the Time Cycle...
The S&P500 index (SPX) saw a remarkable turnaround yesterday after the Wall Street opening. The early futures sell-off came very close to the 1W MA200 (orange trend-line), which has been the ultimate Support level since the March 2009 Housing Crisis bottom (the last major Bear Cycle). It supported the 2022 Inflation Crisis, the 2018 U.S. - China Trade War, the...


