XAU/USD sell setup: **Current Market Condition**: - **Current Price**: 3328 - **Trend**: The trend appears to be in a short-term downtrend, but we need confirmation of the bearish momentum. **Key Levels**: 1. **Support Levels**: - **S1 (3298)**: If the price drops toward this level and holds, it could indicate a potential bounce or consolidation. ...
Trend Overview: Bullish Momentum Intact - **Current Price:** $3,336 - **Trend Direction:** Strong uptrend – higher highs and higher lows - **Key Moving Averages:** - EMA 7: $3,334.49 (price above – short-term momentum bullish) - EMA 21: $3,320.83 (supportive base) - EMA 50: $3,295.57 (strong trend support) Bullish Scenario (Green Arrows) -...
Bullish Scenario – Breakout Above $3,300 Bias: Bullish (Trend Continuation or Breakout Play) Entry Condition: Price breaks and closes above $3,300 on the H1 or H4 timeframe. Ideally accompanied by rising volume and no strong upper wick (shows strength). Entry Point: Around $3,301–$3,305 after confirmation. Targets: 🎯 Target 1: $3,320 – Near-term...
Sell Setup Details - **Entry Point (Sell at):** 3221 The current price of Gold (XAU/USD) is near $3221, and this is where you would initiate the sell position. - **Target Price:** 3200 The target for the trade is $3200, where you expect the price to reach. This is your profit-taking point. - **Stop Loss (SL):** 3230 Set your stop loss at $3230 to...
**EUR/USD (1-Hour Chart) Analysis 📍 **Current Price:** - **EUR/USD:** 1.09484 - **Price Action:** Trading slightly higher (+0.13%) and nearing the apex of a symmetrical triangle pattern. **Technical Overview:** 🔺 **Chart Pattern: Triangle** - **Type:** Symmetrical Triangle (Consolidation) - **Implication:** Price is coiling up and preparing for a...
This is a technical analysis chart of **XAU/USD (Gold vs US Dollar)** on a **30-minute timeframe**, published on April 8, 2025. Let's break it down into key components and scenarios: --- ### 📊 **Technical Indicators:** - **EMA 7 (purple):** 3,005.895 - **EMA 21 (blue):** 3,002.328 - **EMA 50 (yellow):** 3,005.112 Price is currently **around $3,006.665**, just...
Gold (XAU/USD) Chart Analysis **Current Price & Trend:** - Gold is trading around **$3,132.70**, showing continued bullish momentum. - The price is **above all key EMAs** (7, 21, and 50), confirming an **uptrend**. **Key Levels:** - **Resistance (~$3,140-$3,145)** → Price tested this level but struggled to break higher. A successful breakout could push...
Gold (XAU/USD) Market Outlook #### **Current Overview** - **Current Price:** $3,092 - **Key Support Zone:** $3,087 - $3,083 - **Major Resistance Zone:** $3,095 - $3,100 - **Trend Direction:** Uptrend remains intact with price staying above key moving averages. --- ### **📊 Bullish Outlook** - If the price **pushes past the $3,100 resistance**, we...
**EUR/CAD (Euro/Canadian Dollar) currency pair** on a **1-hour timeframe**. Here are the key details: **Chart Analysis:** 1. **Pattern Identified:** - A **falling wedge** pattern has been detected, which is generally a **bullish reversal** signal. - The price has broken out of the wedge, confirming the reversal. 2. **Exponential Moving Averages...
XAU/USD Chart Analysis 1️⃣ Current Price Action: - Gold (XAU/USD) is trading around **$3,073.42**. - The price is consolidating after a strong upward move. 2️⃣ Key Indicators: - **EMA (7) at $3,073.27** (short-term trend) - **EMA (21) at $3,069.34** (medium-term trend) - **EMA (50) at $3,061.97** (long-term trend) - Price is currently above all three...
**EUR/AUD Falling Wedge Pattern - Trade Setup** **Pattern:** Falling Wedge (Bullish Reversal) A falling wedge typically signals a potential breakout to the upside. If price breaks above resistance with strong momentum, a bullish rally is expected. **Trade Details:** 📌 **Entry Point:** 1.71300 (Breakout confirmation above resistance) 🎯...
Gold (XAU/USD) Chart Analysis & Trade Setup **📊 Chart Breakdown:** 1. **Support & Resistance Zones:** - **Resistance Zone (Green - R1 & R2)**: Around **3,030 - 3,040**, indicating a strong supply area where price previously faced rejection. - **Support Levels (Red - S1, S2, S3)**: Between **3,010 - 3,000**, where price has found demand and bounced...
Your **US Crude Oil (WTI) buy setup** is structured with proper risk management in mind. Here's a breakdown of the key elements: ### 📌 **Entry Point: 69.600** This is the price at which you plan to enter a long (buy) position. You should wait for confirmation (such as support holding, bullish candlestick patterns, or volume increase) before executing your...
Most of Traders Lose Their Accounts in the beginning Many new traders fail because they ignore key trading principles. Here’s a breakdown of the five biggest mistakes and how to avoid them: **1️⃣ Emotional Trading – The Silent Account Killer** 😨 - Fear and greed drive impulsive decisions. - **Example:** Chasing losses after a bad trade (revenge trading)...
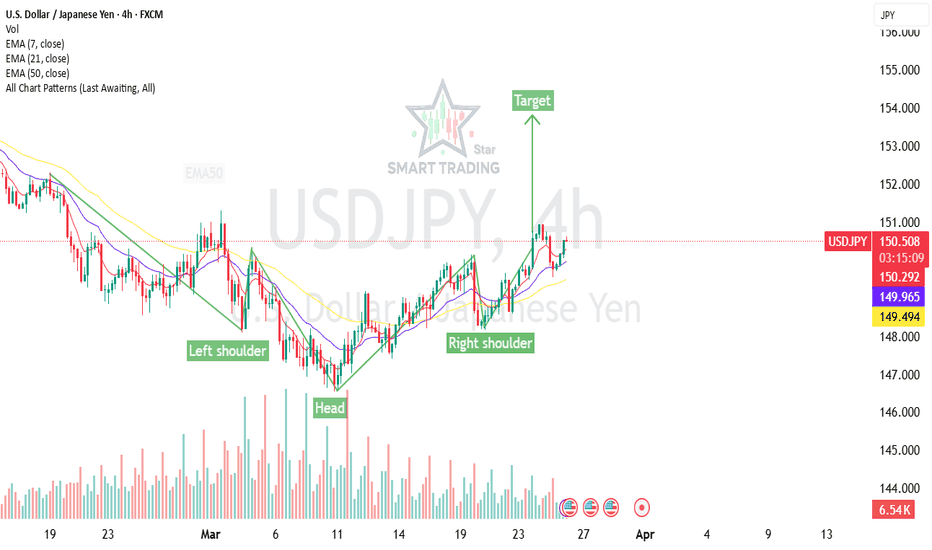
📌 **USD/JPY Buy Setup – Inverted Head & Shoulders** 📌 🔹 **Pattern:** 📈 **Inverted Head & Shoulders** (Bullish Reversal Signal) 🔹 **Entry Point:** ✅ **150.500** (Neckline breakout confirmation recommended) 🔹 **Target:** 🎯 **153.800** (Measured move projection from pattern breakout) 🔹 **Stop Loss:** 🔍 Ideally **below 149.800** (Neckline retest zone or...
Trade Setup Based on Falling Wedge Breakout Entry: Price: 1.07992 (current breakout level) Confirmation: Breakout from the falling wedge, supported by EMA alignment Stop Loss (SL): Technical SL: Below recent swing low Levels: 1.07392 (60 pips below entry) 1.0720 (below key support for extra safety) Target Price (TP): Approx. 1.09300 (measured move from...
📉 XAU/USD (Gold) Trade Setup – Descending Channel Strategy #### **🔹 Summary:** Gold is trading within a **descending channel**, indicating a bearish trend. The strategy is to **sell near resistance** and **target support levels** unless a breakout occurs. --- ### **📌 Bearish Trade Setup (Sell Strategy)** **🔻 Sell Entries:** 1️⃣ **3,020 - 3,030**...
Gold (XAU/USD) 1H Chart Analysis **Bullish Scenario (📈 Uptrend Potential)** - **Key Resistance:** $3,030 - **Support Holding:** Price found support around $3,000 and is attempting to recover. - **EMA Support:** If price reclaims above the **21 EMA ($3,025)** and **50 EMA ($3,030)**, bullish momentum could build. - **Breakout Confirmation:** A clear break...


