I'm gobbling up all the ETH I can. Wish me luck!
Did ETH go back in time??? Is this Dec 2015-Jan 2016 again??? The charts look incredibly similar. Even the RSI and MACD Histogram. Moon incoming ??
ETH to $20k ? ETH punched through the 200 MA on the daily. Things looking good.
Just using historical data to show ETH on a 3 year Bull Run with BTC. Maybe we will see a $130k top by around Dec 2021...
Looks like BTC is in a nice consolidation period for a while. Bull Market incoming! Once the 200 MA crosses back over the 600 MA, I believe it's safe to say we may have entered the new bull run for BTC. The 200/600 MA crossover event will hopefully take place sometime in Oct/Nov this year. Buy low, sell high. Good Luck folks!
The BTC 4 year cycle seems to have started. Good luck everyone!
Lowest weekly RSI in history... are we back to the major support? This might be the bottom folks. Maybe a bit lower as a wick, but still. I'm all in again. This could be a long run to the top over the next few years.
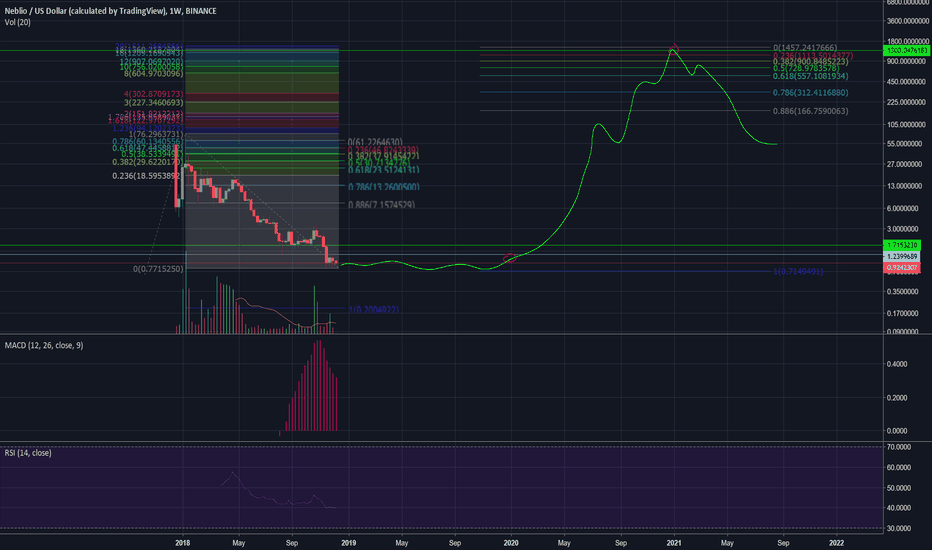
I would say that NEBL will follow BTC during the next bull run likely to start in 2020 and ending around Christmas of 2021. I've picked up a small bag of NEBL at these very low prices ($1.00) to HODL for the next few years, wish me luck! :-D
Following the chart pattern looking long term with BTC, we may see $300k/BTC by Jan 2022. This is using a Fib projection that jumps to 20x as we have seen with the 2014 and 2017 bull markets. Let's hope!
Selloff Volume decreasing Weak MACD And Lowest RSI in 4 years!!! VERY TASTY ! :-D Might get a nice wick down to 2800 or so, and then I'm in for the long term again.
I'm seeing Bullish Divergence on NEBL (Neblio) on the 4 hour MACD. Good luck!
Volume is pretty low so this may not matter as much. The TA is showing bearish divergence on the MACD and RSI with higher high's. :-(
ETH to $6660 by end of June or sometime around July. This isn't me. The chart speaks for itself.
Whoa, 1 ETH = 0.42 BTC by June-July 2018 !!?!?
Binance Coin is looking beautiful for a pump up. It keeps hooking the top of the ascending triangle inside the rising channel. Histogram is showing decreasing negative momentum (bullish divergence indicator). Volume is also decreasing as we approach the end of the triangle. I am not your financial adviser. This is just my opinion.
Cardano (ADA) Looking beautiful heading right to $2.50 by May 30. This is a log scale chart showing nice growth for this alt-coin summer!
Tron has an average of $50 price once we reach 2019.


![Tron $50 in 2019 [log scale] TA TRXUSD: Tron $50 in 2019 [log scale] TA](https://s3.tradingview.com/y/YVEMpoz2_mid.png)


