UnknownUnicorn1770111
Shorting XBT here. Price entered new range 15 min charts Expecting a rejection of prev floor turned ceil
Eth pennant forming, bull flag could reverse trend here. Looking to scalp 15 min charts
NANO/BTC has retraced 80% from March ATH Appears to have bottomed out and waiting for it to fully confirm uptrend here Lots of potential as privacy and master nodes are expected to be trending sectors into late 2018 Watching further to scalp this bottom and looking for a green fatty upcoming here
6/14- Its roughly a few hours after EOS main net launches... I entered short for a quick dump post EOS news announcement spike My entry at 174k Sats Looking at the 15 min charts EOS/BTC and seeking a 10% drop here Small ascending wedge/triangle forming near a strong ceiling spells downward movement likely in near hours Stop loss set slightly above entry and...
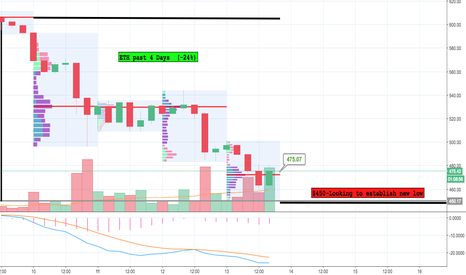
6/13- ETH/USD 4 Hr charts ETH has been a great short these past 4 days as it is down nearly 25% in that timespan Ethereum found some brief support earlier today and bounced off $450 levels $450 is the next floor to break en route to new lows (red text box) Price is currently at $475 USD Ceiling above around $501 If this bounce carries into $490 and up im...
Watchin the hourly ETH/USD as it falls into a fairly unsupported zone. Bears in control at $490. $501 USD has served as a solid ceiling as it was tested numerous times today Below $490 is looking like an overall dangerous zone support wise You can see the 3 black arrows marking a fairly unsupported 14% gap down to $410-$420 and was a former support heading to $415
ZRX is still forming a handle from previous big cup and handle pattern which took 3 months to fully form Some things to note here Coinbase announced today that it will list ETC in the next few months, the first of potentially multiple new tokens on their site Price is moving sideways and downwards in a range of about 18k-14k Sats Support waiting at 13k...
Monday- 7/11- Looking at the 4 Hour Eth/USD Chart ETH currently sitting on $530, waiting on short term bullish signal from crossover in MACD (middle box), RSI is 30 .50 Fib retracement level around $570 should result in a further downward move and lookout below as there is little support until around $420 It is worth noting that BTC went through a "blody...
Looking at a setup for Eth/Usd short term downtrend reversal here. Note the large bullish falling wedge in green starting at $720. There is a nice floor and strong support in blue around $370, the wedge is currently consolidating beautifully. Looking for increase in volume in the next few days to spark the upwards break out. Once price breaks wedge ceiling and...
Symmetrical triangle forming on Daily Eth/Usd charts. Flagpole is established from prev. support level at $850 level. Pennant has yet to complete and is currently consolidating in the third wave. This pattern is bearish and if it plays out would push price down to previous month low $560.
Large fractal around $9300, could be a nice reversal upwards from current downtrend. In order to lock in a solid position we still need to break $11600 mark above the right should and complete inverse HS. More volume could get us here but more importantly volume should be heavy after breakout! Pattern is still valid, still intact, and were still waiting. First two...
BTC up if break through right shoulder around 11600 range. Fingers crossed.
Eth/usd price discovery entered, all time high.
Eth/usd looking to break previous day high. Head and shoulders bottom looking to go on a little run up here. Waiting for prev. high surpassed/uptrend forms.
BTC up after bouncing 2 day low + bullish fractal. Reverse trend is forming and will push price well past 17k


