UnknownUnicorn5944879
If we use the Daily chart to look at the technicals regarding EURUSD we see that there is a clear Head and shoulders pattern that might explain the persistence of the EURUSD to drop. Ofcourse fundamentals are in place too but the technicians and especially the professional ones are looking at the market from a broad view. The next stop should be way down at...
Disappointing news for the USD might bring the USD depreciation and the strong GBP upwards. Unemployment claims higher than expected and final GDP just over 0.1% more than expected for the US
Very dissapointing yestersday with GBPUSD, since there was no retracement when fundamentals kicked in, affecting the technicals. We expect a breakout over 1.1610 to drive the market 20 pips up. If not then consider the support level 1.1590 and the long term downward move at 1.15 when that dive happens.
The market was bearish yesterday when with he GBP loosing strength while the USD was gaining. Most of the pairs having the quote currency USD, were moving downwards showing significant volatility. A 190 pips downward move for GBPUSD, since the European session started, was the result of yesterday's activity. With Powell's and Yellen's talks regarding economic...
FOMC Statement and Federal Funds Rate announcement took place yesterday at 21:00 EEST. It was decided that the rate stays at <0.25%, The market for GBPUSD found support at 1.360. This was a long fall and we are nearly at the end of the trading week. A retracement is possibly at hand. Beware of the breakout upwards when the market passes level 1.369 to reach...
It is clear that the pair has been suffering a long fall since the 16th of Sept. The Fibo retracement looks promising and further fall is unlikely without a retracement first at least where the blue arrow indicates. No significant news/reports for the GBP or the USD to push the pair further down are scheduled so probability of upward retracement is on our side.
Seems that the EURUSD dropped after a significant support break. It is not clear if this s a triangle, however the technicals are showing that a further drop is more probable until the level indicated by the second arrow.
Seems that the EURUSD dropped after a significant support break. It is not clear if this s a triangle, however the technicals are showing that a further drop is more probable until the level indicated by the second arrow.
GBPUSD according to the breakout downwards for the day and the fibo retracement indication that is going to fall even more at the level indicated by the arrow. Its a slow day for a Friday but today is also an NFP day!
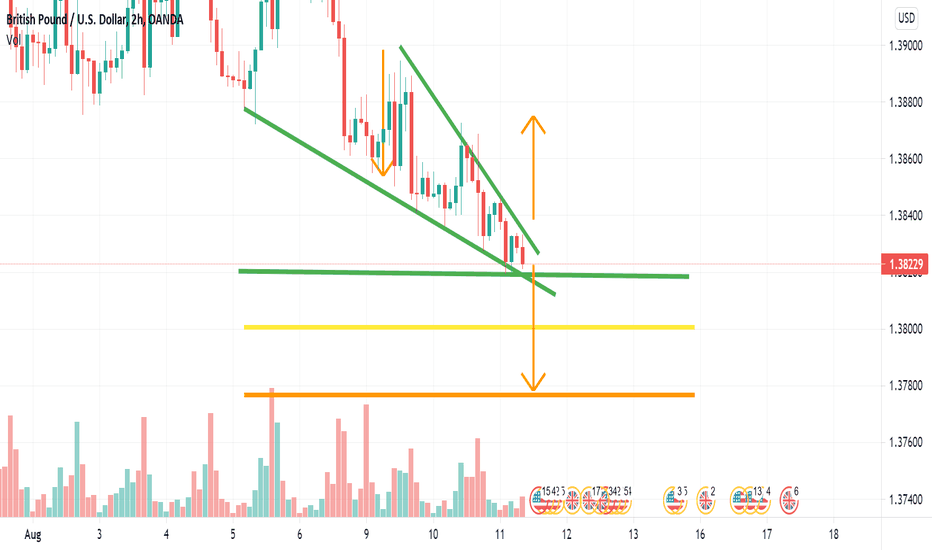
It seems that a downward wedge i formed, period of 4 Days which is quite long. However, a breakout of 1.3820 might actually push the price to a freefall until the level 1.3780. For a more conservative approach the first stop level of positions should be at 1.3800. The price move will be more probable if the CPI report today 11.08.2021 at 15:30 EEST will be in...
It doesn't look a proper wedge but it is a good opportunity since the overall trend is upwards. We will treat this as a proper wedge that just broke the upper line.
A nice Triangle formed this Tuesday. Its a 3 day-Triangle though and for the breaks to happen upwards or downwards the EURUSD needs a good push. Nevertheless, just like all cases the Stops are the ones that matter here after the breaks. As depicted by the arrows: 1.1850 is the downward first expected stop. The upward stop is expected to be at 1.19000. For...
IT is quite obvious that an ascending triangle has been formed. Will this be an opportunity for an upward move? Of course, it must break upwards. Currently, crude oil at price floats around 72 USD/barrel and if we see a significant upward move it will probably reach 73 as a first Stop. Today 28.07.2021 Wednesday, Crude Oil Inventories will be released, last...
A triangle formation has formed. The problem here is that it is not a big one and is subject to more risk. Up or down does not matter since is a triangle and speculation focus on Stop Levels. Even though Upward movement is more probable since the market is moving upwards in general. Nevertheless, it is expected to break around 9:00 - 10:00 EEST and the Stop...
The move upwards seems to have ended and the retracement probably will take place. As always the minimum retracement is at the 61% fibo level (o.38 of the fibo tool). Taking into account the historical Volatility of this instrument suggests a return to the mean. > "Simple, not complicated, best value for time analysis".
It is a long shot but both patterns look at the down side. To be completed might take days but if it breaks downwards it is a very good indication for a drop
It seems that GBPUSD is trying to break downwards. Technical indications show a retracement opportunity.
The index was performing well yesterday 20.07.2021, more than 500 dollars with stop at price/index 34,600 USD. Potential retracement at price 34,360 USD. >> The Fibo retracement to at least 61% of the move might be possible, considering the volatility these days. >> The problem with indices is that the Stock market is open after 16:30 EEST and then is where...


