VictorWTChan
I bought AMR in mid-2023 due to an overly pessimistic view of global coal demand. It doubled within half a year.
Unless all other grains, rice has reached a new 52-week high.
Hang Seng Index at Long-term Trendline Support?
NASDAQ showing rejection at the upper Bollinger Band
Bearish Elliot Wave Count on S&P 500. According to his, we are just off to the first leg of a new downtrend.
In previous bear markets, the monthly high always gets below the 20-month moving average, which has not happened so far.
1769HK Scholar Education is near the breakout point of a double bottom base.
Has Silver finally got out of a bear market for the next run?
Weibo (WB) closed right at the 4.5 pt/mth line all the way back from Q1 2018. Is it going to break out despite news of the trader war?
NVDA broke above an 8-month long triangle with rising momentum in MACD.
Is Copper finding support on the 200-month moving average? If you zoom in, you will also find a falling wedge pattern on the daily chart.
Tesla between the 1x1 Line and the 2x1 Line on the Way Down
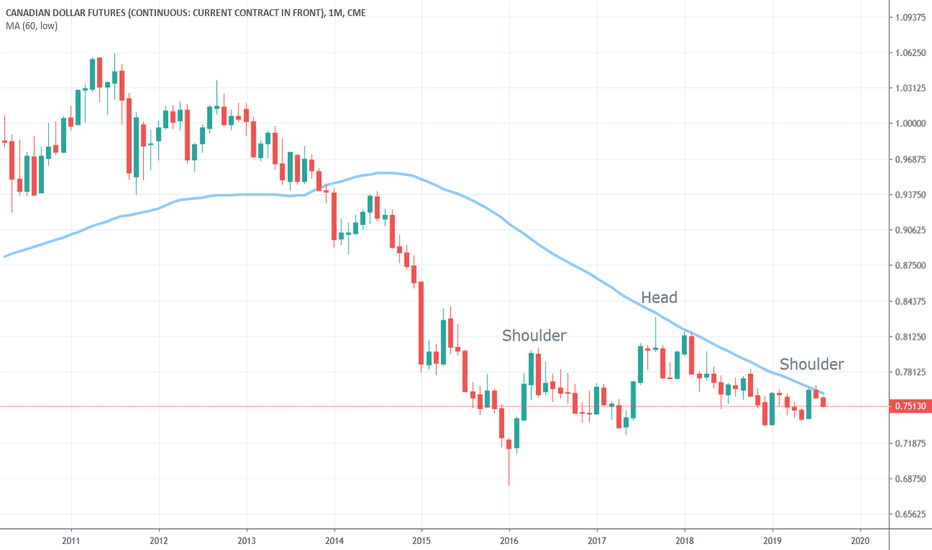
The monthly chart of the Canadian Dollar futures (continuous: current month) shows a giant head-and-shoulders with resistance at the 60-month moving average (low).
XAUJPY just broke out of a 6-year triangle.
Onshore/Offshore RMB (CNYCNH) spiked above 1.017 since late 2015 and early 2016, suggesting that capital is leaving Mainland China.
High yield bonds (junk bonds) hit monthly resistance line. Fundamentally, the US corporate debt has almost doubled since 2008. Right now over 50% of them in the market are BBB, which is just a cut above junk. Further analysis: youtu.be/V7zEXiqiiqA
SPX has been being held up by the “14 points per month” line projecting from the 2019 low If you are into Gann/astrology, you’ll know that it’s half of the Helio Saturn angle (28 points per month). Diminished momentum going up as seen by bearish divergence in monthly RSI. Will SPX hit the half H-Sat support again before going higher?


