🟢 VIX – “Liquidity Pool Bounce & Reversal Setup” 📅 Date: April 22, 2025 ⏰ Multi-Timeframe Analysis (12h, 1D, 1h, 30m, 5m) 🔎 Global Context: The Volatility Index (VIX) is reacting to a clear institutional liquidity zone (blue area) across multiple timeframes (12h, 1D, 1h), aligning with a mean reversion move following the explosive rally earlier this month....
📊 Technical Analysis: NASDAQ:TSLA (Tesla) 🗓️ Updated: March 24, 2025 🚨 Critical Zone Being Tested After breaking out of a multi-year symmetrical triangle, NASDAQ:TSLA is now retesting the upper boundary of the pattern — perfectly aligned with the key ACTION ZONE (liquidity zone + long-term MAs). 🔵 ACTION ZONE ($245–265): High-probability decision area....
Daily (1D) Chart Analysis Trend Overview: BTC has been in a downtrend since its recent peak above $100K, trading below the 100 EMA (yellow) and 200 EMA (white). Support Zones: The key support zone is around $75,000 - $77,000, where buyers could step in. Resistance Zones: The major resistance sits near $91,000 - $95,000. Momentum Indicators: RSI: Around 40,...
📉 Best Risk/Reward Setup: SHORT on 200 EMA Rejection 🔻 Entry: Sell in the 148.50 - 148.80 zone after rejecting the 200 EMA (⚪) 🎯 Take-Profit (TP1): 146.50 (RRR: 5:1) 🎯 Take-Profit (TP2): 145.00 (RRR: 9:1) 🛑 Stop-Loss (SL): 149.20 📊 Market Overview & Bias 🟥 Bearish Outlook (Macro Trend - Daily & 4H) ✅ USD/JPY remains in a clear downtrend, trading below the 200...
Short after Resistance Test ($3,005 - $3,010) 📌 Entry: Sell within the $3,005 - $3,010 range if there is a clear rejection and price weakness. 🎯 Take-Profit 1: $2,985 (immediate support) 🎯 Take-Profit 2: $2,970 (recent lows) 🛑 Stop-Loss: $3,015 (above resistance) 🔹 Probability: High – Confirmed by weak volume on rallies and strong resistance. Trade...
📈 LONG SETUP - BUY THE DIP (Swing Trade) Entry: 22,350 - 22,400 Take Profit (TP): 23,500 (first target), 24,000 (extended target) Stop Loss (SL): 22,150 Reasoning: Strong historical support at 22,300 - 22,400. Bullish divergence on MACD and RSI on 1H and 4H charts. High timeframe trend remains bullish; expecting continuation after the...
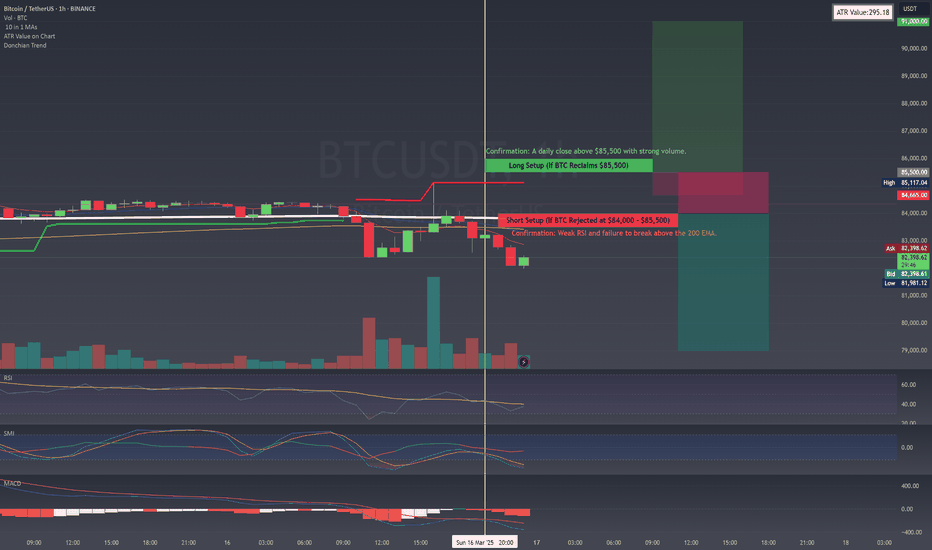
📈 Bullish Scenario: Breakout & Retest of the $95,000–$99,500 Zone 🚀 🔹 Idea: Price breaks above the strong resistance around $95,000 and holds it as new support on a retest. 🎯 Potential Entry: ✅ Trigger: A clear break and close above $95,000 on the 1H or 4H chart, followed by a pullback to retest $95,000–$96,000 as support. ✅ Confirmation: Enter on the first...
Why This Zone? If gold breaks and closes above ~2,770–2,775, it suggests bullish continuation toward 2,780–2,800 or more. Possible Setup Type: Buy Stop at ~2,775 (anticipating a breakout) Stop‐Loss: ~2,750–2,760 The idea is to keep stops relatively tight if the breakout fails. Take‐Profit Targets: ~2,790–2,800 (a 15–25 point run above your entry). If...
With December comes ... Phase B; at least I hope it does... everything looks that way. Classic Wyckoff Distribution... looks like a textbook example until now... let's hope it continues like that. In the Wyckoff Method, Phase B represents the range-bound period after accumulation (Phase A) and before the price breaks out. Here's how to identify signals...
Short scalp from PSY 12H to SC 1H continuation from: and: AUD/JPY Uptrend Continuation from AR in Phase A to ST in Phase B
1h CONTINUATION FROM THE AUD/JPY Uptrend Continuation from AR in Phase A to ST in Phase B THIS IS MY ENTRY SCENARIO
In the Wyckoff Distribution schematics, the transition from Automatic Rally (AR) in Phase A to Secondary Test (ST) in Phase B is crucial for understanding market behavior, especially on higher timeframes like the 12-hour chart of AUD/JPY. Phase A: Automatic Rally (AR) In Phase A, the AR is typically the first significant price increase after the Selling Climax...
My Trade: A long trade at 18,730 on the DAX 30 is a bullish bet, signaling an expectation that the index will continue its upward momentum. Here’s the reasoning behind this setup: Technical Indicators: The DAX remains above key moving averages, including the 50-day and 200-day EMAs, which are traditionally seen as bullish indicators. A breakout from the 18,750...
Any plans for November? 'Just chilling and waiting to fill up bags with this setup!' NOTE: Please note that the SPRING is not confirmed yet! suport can be found at this level or below at 1859 or even lower, realistically everything is possible until 1805. But probabilities say it shouldn't go so low. So what is Wyckoff, and why I use it before everything...
Wyckoff’s Accumulation Schematics ( EURUSD 9Nov 09:25 - 11NOV 16:50) I am trying to learn Wyckoff’s Accumulation Schematics by finding and identifying them on different charts. I found this one, and thought that looks like a textbook example. just sharing it so it maybe helps others. feel free to correct me if there some error. cheers


