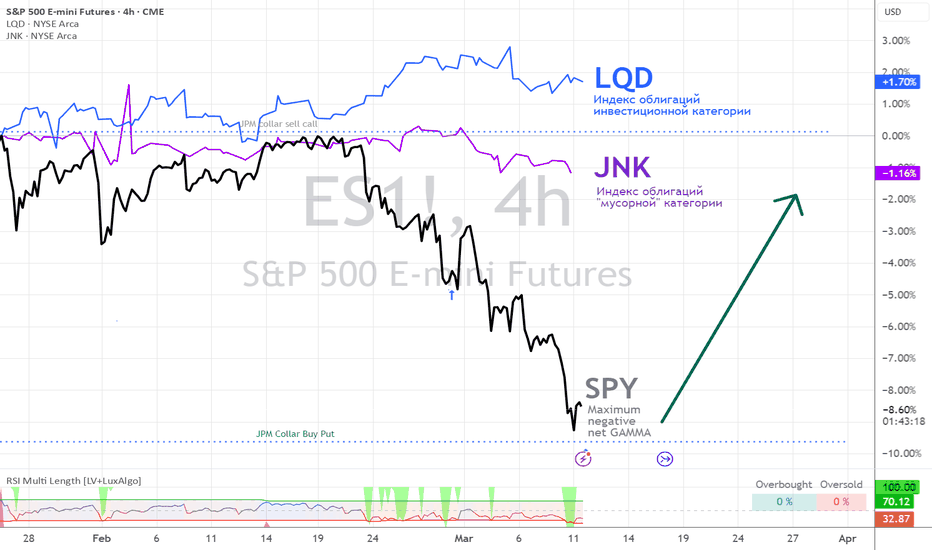
Bonds market smarter than stocks - bond investors sees bright future
Good long term point to buy with the stop loss -14% only
Hi all! I feel the approach of good times in Russia!!💓 On the chart - at the top in black is the rate of the Central Bank of the Russian Federation, next to it in blue - the yield rates on short-term bonds, at the bottom - the RTS. There will be a meeting of the Central Bank of the Russian Federation soon and everyone will be given the message that “the Central...
it is based on relation btc to gold. 1/ calculate ratio btcusd/xauusd 2/ add ROC or bollinger (or any) indicator which will show bias from average (i like "bolinger bands percentile suite") 3/ green and red lines - highlighted zones for buy and sell
This track relative price dynamics of the gas and oil
bonds trarting to move before commodities stocks moves after
oversold overbought areas by relative speed MARA and BTC
This layout monitors main bissines parameters for indyka energy.
Ratio of the price oil in gold moves in ranges, and its extremalities lead to significant changes of trend. May be gold have common value not linket to any obligations, gold have stable value whereas dollar may be devalued or reflated
1 step - - calculate difference between rising anda falling stocks and ETFs 2 step - - calculate 9-period moving avverage 3 step - - calculate bolinger bands (i use indicator "BB Percentile Suite") Usage Overbought when last 9 days prevail voumes on rising stocks. BB in upper threshold. It means that the crowd already bought a lot of stocks. All - optimists....
Monitor to compare ruble exchanre rate and bonds market/ See on relarion rubble to bonds
it is possible to jump to 45 on VIX by august Levels and dates calculated by wolfe wave
- when wheat is too cheap to corn - there is the great chances to buy wheat.
Easy to screen is MSTR ower / under valued to btc see it contrary
Good indicators for market meltdown Healine CPI falling faster than Core- is not good for economy/
AMEX:VGK/AMEX:SPY M1 destruction in europe leads to lower european PMI


