Hi Traders, on March 20th I shared this idea "Gold - Expecting Retraces and Further Continuation Lower" We expected to see retraces and further continuation lower. You can read the full post using the link above. The bearish move delivered, as expected!!! If you enjoy this idea, don’t forget to LIKE 👍, FOLLOW ✅, SHARE 🙌, and COMMENT ✍! Drop your thoughts...
H1 - Bullish trend pattern in the form of higher highs, higher lows structure Strong bullish momentum Bearish divergence on the moving averages of the MACD indicator. Expecting retraces and further continuation higher until the two strong support zones hold. If you enjoy this idea, don’t forget to LIKE 👍, FOLLOW ✅, SHARE 🙌, and COMMENT ✍! Drop your thoughts...
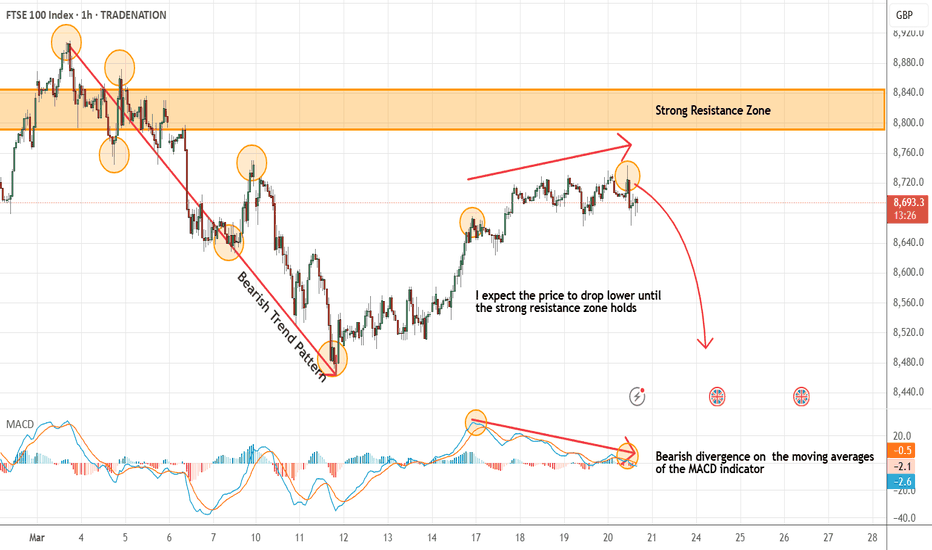
Hi Traders, on March 11th I shared this "UK100 - Looking To Sell Pullbacks In The Short Term" We expected to see correction prior to the bearish continuation. You can read the full post using the link above. Price is moving as per the plan!!! Based on the current scenario my bearish view still remains the same here. We have bearish divergence in play based...
H1 - Bearish divergence on the moving averages of the MACD indicator. Followed by bearish trend pattern in the form of three lower highs, lower lows structure Strong bearish momentum Potential drop after retraces if the strong resistance zone will not be broken. If you enjoy this idea, don’t forget to LIKE 👍, FOLLOW ✅, SHARE 🙌, and COMMENT ✍! Drop your...
Hi Traders, on March 12th I shared this "EURJPY Short Term Buy Idea" We expected to see correction prior to the bullish continuation. You can read the full post using the link above. Price is moving as per the plan!!! Based on the current scenario my bullish view still remains the same here. We have bearish divergence in play based on the moving averages...
H4 - We had a strong bullish move with the price creating a series of higher highs, higher lows structure This strong bullish move ended with a bearish Divergence While measuring this strong bullish move using the Fibonacci retracement tool we have two key support zones that has formed (marked in green) So based on this I expect potential short term bearish...
Hi Traders, on March 13th I shared this "EURAUD Short Term Buy Idea" We had a strong bullish momentum on the 4H chart and I mentioned that I expect pullbacks towards the marked key support zones and then a potential continuation higher. Price has currently reached the first key support zone with the price developing a bullish divergence. Expecting the price...
H1 - Bearish trend pattern Strong bearish momentum Potential drop if the resistance levels will not be broken. If you enjoy this idea, don’t forget to LIKE 👍, FOLLOW ✅, SHARE 🙌, and COMMENT ✍! Drop your thoughts and charts below to keep the discussion going. Your support helps keep this content free and reach more people! 🚀 Disclosure: I am part of Trade...
H4 - Strong bullish momentum Currently it looks like a correction is happening Until the two key support zones hold my short term view remain bullish here.
H4 - Bullish trend pattern Expecting corrections now and then potential continuation higher until the two strong support zones hold.
H1 - Bearish trend pattern Currently it looks like a pullback is happening Until the strong resistance zone holds I expect the price to move lower further after pullbacks.
H4 - Strong bearish momentum Lower lows Until the two strong resistance zones hold my short term view remains bearish here.
H1 - Bullish trend pattern Strong bullish momentum Until the two strong support zones hold my short term view remains bullish here.
H1 - Bearish trend pattern Currently it looks like a pullback is happening Until the strong resistance zone holds I expect the price to move lower further after pullbacks.
H1 - Bearish trend pattern Currently it looks like a pullback is happening Until the strong resistance zone holds I expect the price to move lower further after pullbacks.
H1 - Bearish trend pattern Currently it looks like a pullback is happening Until the strong resistance zone holds I expect the price to move lower further after pullbacks.
H1 - Bullish trend pattern Strong bullish momentum Expecting pullbacks and then potential continuation higher until the strong support zone holds.
H4 - Bullish trend pattern Currently it looks like a pullback is happening Until the strong support zone holds I expect the price to move higher further after pullbacks.


