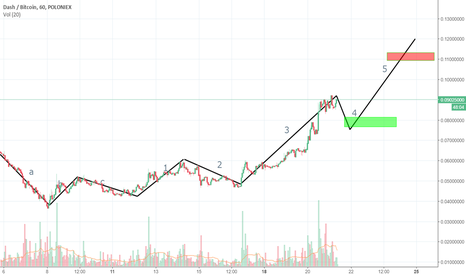
Wave analysis showing what next impulse may look like. Appears to be finishing ABC and beginning to test support.
Trx showing bullish macd just crossed getting ready to move upward and toward 1200 area soon
Earlier chart in 240 min zoomed following progress macd and rsi looking good
Large wave chart showing sub to hit 50k sats long term. This coin has exceeded expectations so far, I want to see how this goes :) 1/11/2018 :D
Charted this during the correction earlier, looking like DNT could be taking off very soon. MACD just crossed Time i drew the chart is the blue arrow. So far following the chart exactly I will look back to assess positions
Looking at the accuracy of the original chart i drew. The blue arrow indicates the point in time i drew the chart. Target of 2500 was exceeded for approximately +70% trade.
Looks like wave 5 is forming on this run, target around 28000
burst hitting resistance at 490 once it breaks out itll continue upward
Mapping supercycle of wave pattern, currently moving into a new cycle. Note Fib points for bounces Still havent had a reversal signal so this is good. Could be just the first wave of grand supercycle Looking for buy opportunities in alts
Longer view of wave pattern over the past month, larger cycle


