Looking for a further upside on #GOLD, we have two biases but in the same direction. 1. We have an impulse pattern formation. We already have a 1-2, and we can project a 3rd wave to occur and potentially make new highs. 2. We have a correction pattern projecting; waves A and C are often equal, and we can expect the price to continue collapsing after the wave A formation.
Projecting an upside direction to complete the impulse sequence. We're in a 3-4-5 of a (3)rd wave. We can project a wave 5 completion. Note** waves 1 and 4 cannot overlap, so we can use wave 1 high as an invalidation level.
Looking for a further decline on CADJPY daily timeframe, to complete the 5waves sequence. We're in a wave (3) sequence, which is always an impulse pattern. We can project a price to make a new low relative to the current 3rd wave.
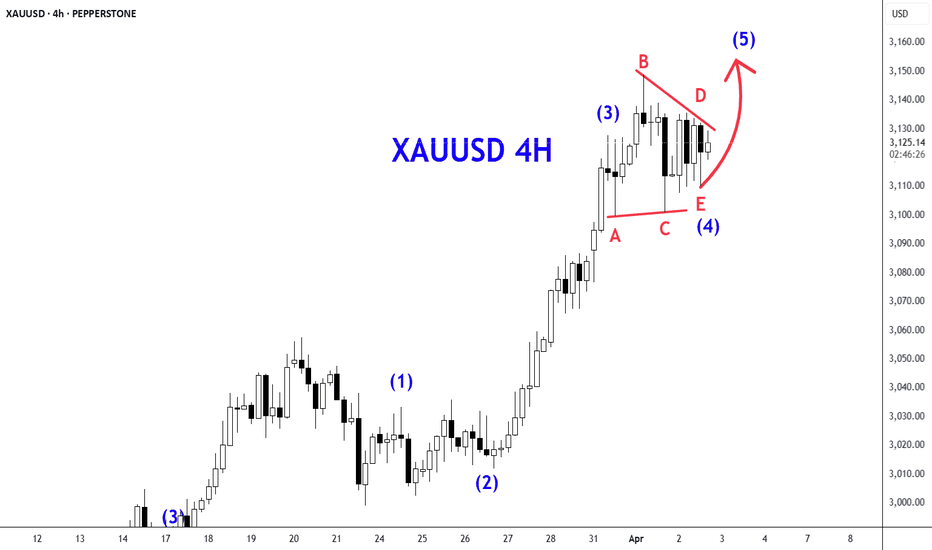
Looking for further upside on #GOLD we have an impulse pattern up. Waves 1 and 4 not overlapping and projecting a fifth wave completion. Wave 4 is a running Triangle pattern.
Looking for a further decline on the DXY, we have an impulse formation down. Projecting a wave 5 to complete below the previous low.
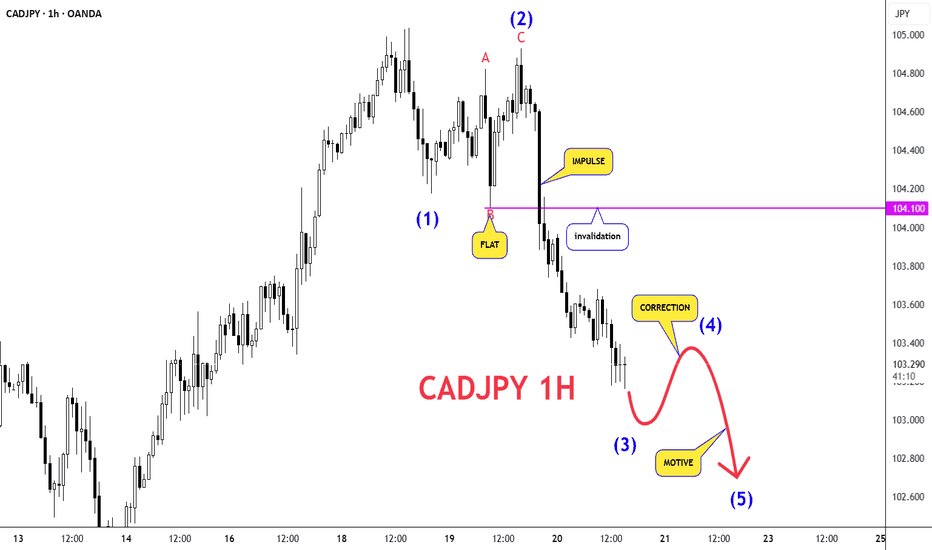
Projecting a further decline on CADJPY as a 5waves sequence or a potential correction pattern A-B-C. We come from a bullish impulse formation, which is now complete. If you take note,* we broke below the momentum trendline, and now we're making lower highs, indicating the trend is ending and changing the trend.
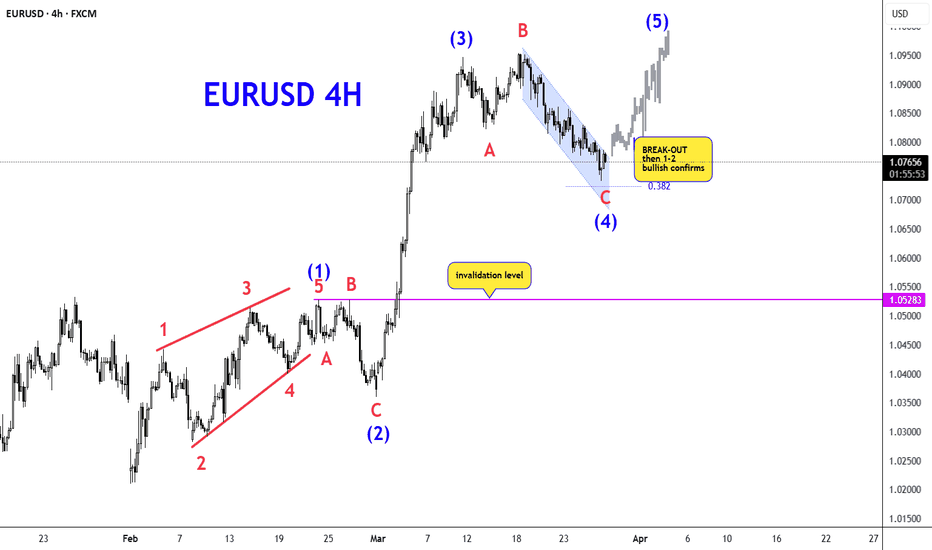
I'm still projecting the EU to be bullish as an impulse, though the correction is getting more complex. However, we're trading to a Fibonacci golden zone 38,2, and we can expect potential buys from there. We need to see a break-out of the channel, then retest( 1-2 wave sequence ) and focus on wave 3.
Looking for a potential sell continuation on AU, either it being an impulse down or a correction down. Currently projecting a wave 3/C, which is gonna be a 5-wave sequence as well.
Projection of further buys on #SILVER We have an impulse pattern formation. Waves 1 and 5 are typically equal with that idea, we can anticipate the price to continue moving to the upside and break the current minor range.
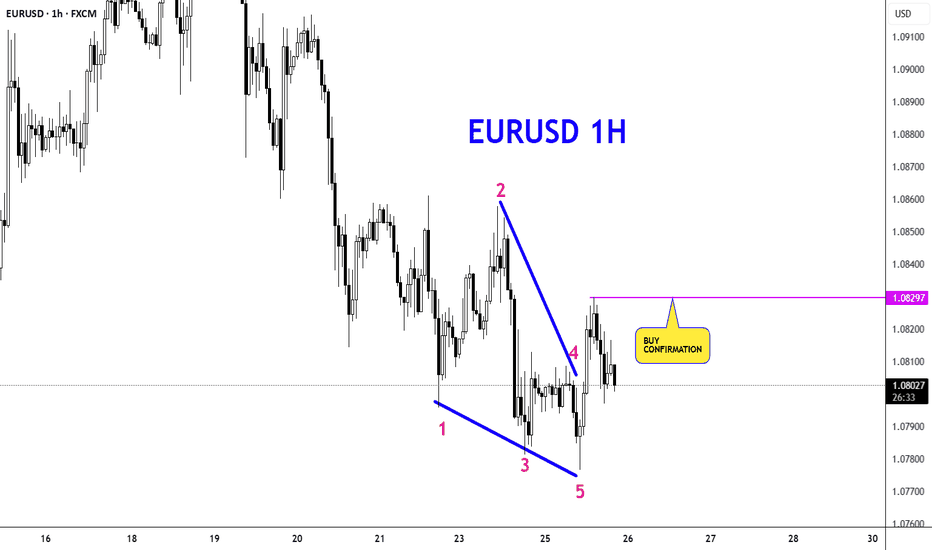
looking for potential buy opportunities if price breaks above the previous high; anything below that, the market could still go down. If you note the EU has been making lower lows for a while now, trying to buy this long-term would be trying to catch a falling knife- maybe for short-term buys, yes. The market is still in a 4th wave correction, and it doesn't show...
Looking for a bearish outlook on UCAD as a potential Leading Digonal pattern, note* it can also be a 1-2 1-2 pattern. Even if price re-prices by moving up, making all these pullbacks, the main direction is bearish.
We're in a correction A-B-C pattern typically wave A and C are equal so we can expect further upside to complete the Zig-Zag. Wave A is a diagonal pattern, wave B is flat, and wave C is an impulse.
Still anticipating the price to move in the bullish direction, we have an impulse pattern up. Waves 1 and 4 are not overlapping. Wave 2 and 4 are a flat correction. Hopefully, we break-out of this consolidation.
We're in an impulse sequence down, anticipating a 4-5 formation. Wave 3 is also not yet complete we can see a short-term decline before we can see a pullback to form a wave (4)
We're in an impulse pattern to the upside, forming a wave 4. Potential Zig-Zag correction pattern. We can expect it to retrace to the 38,2 before getting a rally.
We're in an impulse down, forming wave 4 as a Zig-Zag correction. I project the price to touch 38,2 and we can expect a collapse after that rally.
Anticipating a sell-off on the USDJPY, we have an impulse pattern to the upside as a double correction pattern. Wave (W) is a simple Zig-Zag correction, wave (X) is a simple Zig-Zag correction, and wave (Y) is a simple Zig-Zag correction. Wave (W) and (Y) are equal we can anticipate a collapse after the price reaches 150.030
We have an impulse pattern down following all of the Elliott Wave Theory Guidelines. Anticipating a further decline to make a 5th wave on the blue degree potentially breaks the previous lows.


