alexgrama
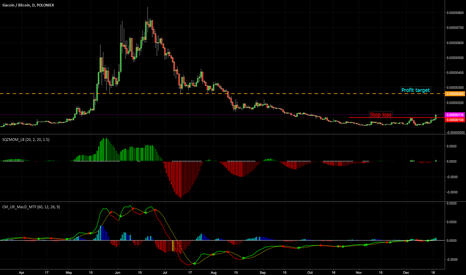
HERE IT IS !!!! SC EMA20 is about to CROSS UP EMA200 indicating a possible uptrend of proportions. When was it the last time it happened, well, look back a few years. HOW TO ACT ON IT: Use the DAILY chart. After EMA20 crosses up EMA200 wait for the first DAILY green candle to close above EMA200 and BUY Stop loss is EMA20 goes bellow EMA200 Take profit...
EMA20 above EMA200 Previous encounters presented on chart. Go long now, stop loss if EMA20 goes below EMA200, take profit before Resistance depicted on the chart.
chart (1 hour) After EMA20 crosses up EMA200 Buy at first green close above EMA200 Stop loss if EMA20 goes below EMA200 Take profit if EMA20 has a consistent downtrend toward EMA200.
After a long downtrend, 20 EMA (on the graph in ORANGE) shows signs of a possible uptrend. FACT: 1. 20 EMA shows an uptrend 2. Resistance and support converge in the next few weeks 3. There are 3 ways of going after convergence: a) above support b) bellow resistance c) between support and resistance PROGNOSIS AND ACTIONS: Depending on the case as...
Notice the BLUE vertical line on all indicators and match them with current situation. Dashed lines in indicators will help you identify the levels. In my opinion we are in for a possible massive uptrend on SC possible 500-700% in a short span. Do not gamble plan for a stop loss as well. best of luck.
Everything in the picture. 70/30 : UP/DOWN chances given the STOCHASTICS at 30 level now. 50/50 : UP/DOWN chances given RSI. TRENDS in DASHED LINES RESISTANCE in SOLID RED
SC passed the local downtrend a few weeks back(ANGLED DASHED RED LINE) SC just passed the downtrend resistance (ANGLED RED LINE) We are in for a recovery of SC with some local resistance but only a major resistance at 200+ sats. if you got in, be happy for your choice. If you are not you should strongly consider as the trend will develop fast (given previous...
According to chart markings. XMR Stochastic, uptrend expected.
AMPBTC went up every year and down at the end. It has done this twice already. Confirmation of new rise done with: OBV - confirmed with green markers. Reason it did not go up at some point is RSI too low RSI - blue markers. Red arrow shows reason for not going up. MACD - levels confirm previous position as well. BUY at first Green Closing candle (1 Day candle)...
STRAT had just gone through a resistance level. Looking at the OBV (On Balance Volume) chart we can see: 1) At the same PRICE(first going back in time) it had a lower OBV 2) Same OBV level now was at a higher PRICE in the past (identify levels with dashed horizontal lines and marked with arrows) Proposal is to buy now and : a) SELL in PROFIT AREA or sooner if...
SC just broke both short and mid term downtrend. SC expected to go up to Resistance 1 or 2 lines following short term uptrend line.


