Gold (XAU/USD) bounced off support at $2,971 and is now testing the $3,009 pivot. Price remains capped below the 50 EMA at $3,058. A break above this level could trigger a push toward $3,100 and $3,137. Failure to hold above $3,009 puts $2,941 back in focus. RSI is recovering but remains under 50, suggesting momentum is still fragile. Watch for a decisive move...
Gold has broken below its channel and is testing the 200 EMA near $2,991. Resistance at $3,075–$3,087 now caps upside. Breakdown below $2,972 exposes $2,926. ⚠️ Watch for sustained move below $2,972 to confirm bearish continuation. Recovery above $3,075 could flip bias near-term bullish.
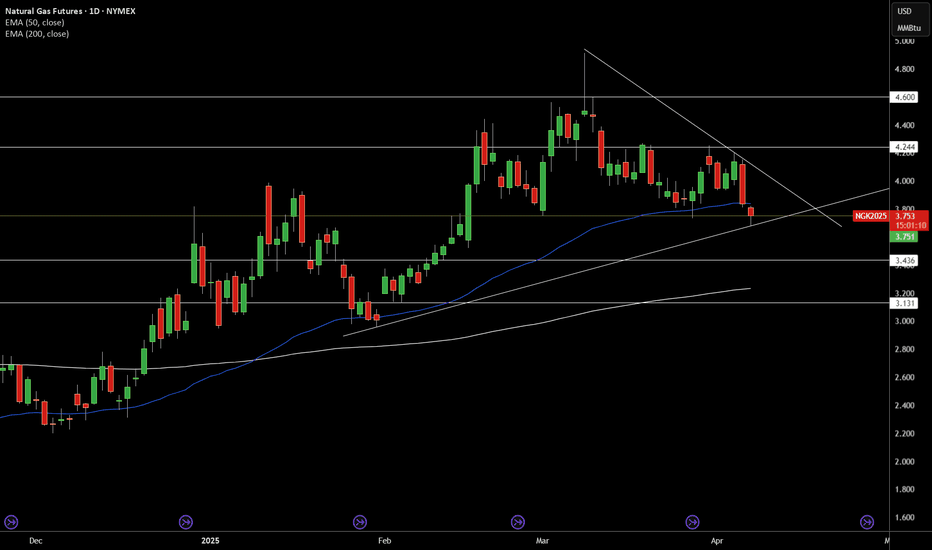
Natural Gas is approaching apex compression, holding above an ascending trendline while capped by a descending trendline from March highs. Price is testing the 50 EMA at $3.83 with a key horizontal level at $3.75 in focus. A break below could trigger downside to $3.43. On the flip side, a breakout above $4.00 could open a run toward $4.24. RSI at 37 supports...
Brent crude plummeted after forming a tight flat flag near $72. A violent breakdown followed, pushing price to $63.71 with strong bearish candles. RSI near 27 suggests extreme conditions, but momentum still favors sellers. As long as $68.59 (previous support) is not reclaimed, the focus shifts toward $61.74 and $59.91 Fibonacci extensions.
WTI has completed a textbook flat continuation pattern with a bearish engulfing candle slicing below $65.40 support. Price is now hovering near $60, with downside momentum targeting $58.45 and $56.50 next. RSI remains deeply oversold near 26, hinting at potential for a relief bounce. However, as long as price stays below the 50 EMA ($69.05), bearish bias...
XRP/USD Bounces Back to Retest Resistance - Potential Sell Trade
Bullish breakout signals targets of $102,500 & $103,800 next. RSI hints at strong momentum but watch for short-term corrections. Is $105,250 in sight? 🔥 #Bitcoin #CryptoNews #BTC
Bullish breakout signals targets of $102,500 & $103,800 next. RSI hints at strong momentum but watch for short-term corrections. Is $105,250 in sight? 🔥 #Bitcoin #CryptoNews #BTC
Bitcoin surges past GETTEX:97K after breaking an ascending triangle pattern! 🚀 Next stop: $100K? Fibonacci levels suggest more upside.
🚨 Bearish Divergence 🚨 Solana is showing signs of exhaustion near $260–$311. 🔹 Rising wedge pattern adds downside risk. 🔹 Key supports: $193, $155, $114. If Solana fails to break above $260, a move below $193.34 could confirm a bearish trend. Manage positions wisely.
Ethereum holds steady at $3,125, eyeing $3,188 resistance. Key support lies at $2,770 (61.8% Fib). Breakout above $3,447 could target $4,000+. #ETH #Crypto
Bitcoin is currently trading within a downward channel at $56,551, with immediate resistance at $59,329. The 50-day EMA at $58,225 and RSI of 41 suggest bearish momentum. If BTC breaks below $55,573, the next supports are $54,000 and $52,138. Watch for a breakout above $57,445, which could change the trend to bullish. For now, the bias remains bearish under the...
AUD/USD is consolidating below the 50-day EMA, with a series of Doji candles signaling indecision. A break below the 0.6710 support could spark further selling pressure, targeting the 0.6670 level. The RSI is holding below 50, reinforcing the bearish outlook.
AUD/USD is consolidating below the 50-day EMA, with a series of Doji candles signaling indecision. A break below the 0.6710 support could spark further selling pressure, targeting the 0.6670 level. The RSI is holding below 50, reinforcing the bearish outlook.
Gold is testing the crucial resistance at $2,500, which aligns with the upper trendline and 50-day EMA. A successful breakout above this level could trigger bullish momentum toward $2,513 and $2,527. However, failure to break above may lead to a pullback toward $2,482 or lower. Keep an eye on RSI as it approaches the 50 level, signaling potential strength.
Given the current market conditions, it would be prudent to consider selling below $0.0000085, especially as the price continues to face trendline-driven resistance. If the bearish momentum persists, we could see further declines toward the next support levels at $0.00000766 and beyond.
EUR/USD at 1.08454, showing a marginal downtrend; pivot at 1.0805. Resistance levels at 1.0865, 1.0920, 1.0985; support at 1.0749, 1.0682, 1.0620. RSI at 43, MACD crossing above signal line, 50-day EMA at 1.0846; trend neutral to slightly bearish.
GBP/USD at 1.27034, showing a slight downtrend; pivot at 1.2644. Resistance levels at 1.2706, 1.2768, 1.2835; support at 1.2585, 1.2516, 1.2449. RSI at 47, MACD slightly bearish, 50-day EMA at 1.2711; market trend neutral to bearish.


