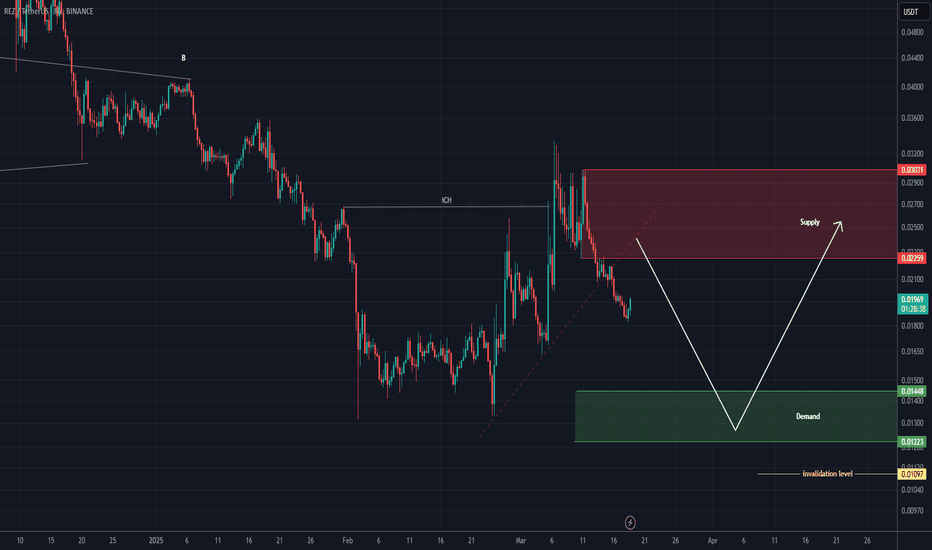
ALT appears to be in a large-degree bearish wave C. If it reaches the red zone, we can look for a sell/short position targeting lower levels. The minimum time required for wave C to complete is marked by the vertical line on the chart. Keep in mind that this is the minimum duration—if the wave extends, it may take longer. A daily candle closing above the...
Before anything, pay attention to the timeframe of the analysis. This is a 2-day timeframe, so it will take time. The green zone is where Bitcoin can start moving toward the specified targets. If the ATH is broken, Bitcoin could also move toward $120K and $140K. However, based on the chart, there is currently no certainty about Bitcoin’s final target. Reaching...
The NIL correction started from the point we marked as Start on the chart. This correction appears to be a Diametric, and it seems we are currently in wave E of this pattern. The price is expected to follow the path indicated by the arrow. A daily candle close above the invalidation level will invalidate this analysis. invalidation level: 0.521$ For risk...
First of all, please note that this is a meme coin, meaning it comes with high volatility and is considered risky. Pay attention to the timeframe — it’s a large and long-term one. It appears that a symmetrical pattern is coming to an end, and this token has gone through a decent time and price correction. As long as the green zone holds, it can move toward the...
From the point where we placed the red arrow, it appears that the bullish MORPHO wave has ended, and the price has entered a corrective phase. This phase could be a diametric or symmetrical pattern. Wave G is expected to complete within the green zone. We anticipate a return of 30% to 50% from the green zone. A daily candle closing below the invalidation level...
From the point marked on the chart, the STRAT correction of AKT has started. This correction appears to be a diagonal. We are currently in wave E. We are looking for buy/long positions in the green zone. Targets are marked on the chart. A daily candle closing below the invalidation level will invalidate this analysis. For risk management, please don't forget...
Despite all the positive news, it couldn’t maintain its bullish trend, as seasoned whales typically don't enter the market at the end of bullish waves. The zone we’ve highlighted is where we believe whales will enter Cardano. Due to heavy buying pressure, the price could experience a 50% to 80% surge. From the point marked with the green arrow on the chart,...
It appears that the NEIROETH diametric pattern started from the point where we placed the green arrow on the chart and completed at the point where we placed the red arrow. Since the bullish pattern has ended and the price is below the descending trendline, sell/short opportunities can be considered in the supply zones. The target could be the green...
First of all, it's important to understand that each group of cryptocurrency tokens follows a different path NEIRO falls into the meme coin category. The performance of Layer 1 coins or other groups may differ significantly from meme coins, so keep in mind that NEIRO’s path is not the same as that of all altcoins! Based on the point where we placed the red arrow...
It appears to be inside wave D, which is a symmetrical wave. At the bottom of the chart, there is a liquidity pool and a strong support zone. We’re looking for buy/long positions in the green zone. Targets are marked on the chart. A daily candle closing below the invalidation level will invalidate this analysis. For risk management, please don't forget stop...
After wave A was completed, from the point where we placed the red arrow on the chart, it seems the price has entered wave B. Wave B is a bearish symmetrical wave, and it currently appears that we are in the early stages of wave I, which is a bearish wave. From the supply zone, we expect a rejection towards the Fibonacci levels of wave a to i, which corresponds...
The correction for this coin started from the point where we placed the red arrow on the chart. The price appears to be inside a Triangle or Diametric, nearing the end of wave D. The green zone is a low-risk rebuy area. There is a liquidity pool on the chart, which we expect to be swept soon. Targets are marked on the chart. A weekly candle close below the...
On the chart, we have consecutive trigger lines that have been broken, and after the SW L, we see a bullish iCH and higher Ls, which are bullish signals. However, considering the Bitcoin dominance chart, buying altcoins or taking long positions on altcoins is risky. It is better to look for short setups on altcoins instead. Targets are marked on the chart. The...
If we look at Bitcoin on hourly timeframes, we expect a rejection from the red zone. However, this rejection must be strong because if it is weak, Bitcoin may not be inclined to correct further or might at least enter a choppy corrective trend. The substructure is also bearish, a trigger line has been lost, and ultimately, we have a bearish iCH on the...
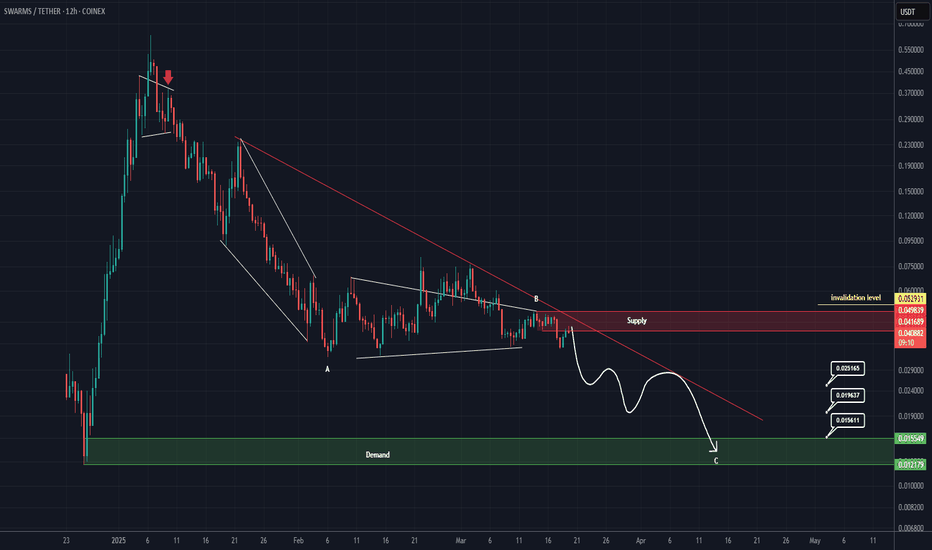
The correction of SWARM has started from the point where we placed the red arrow on the chart. It appears that wave B has just completed, and the price is currently forming a pivot for another drop. We expect to enter wave C soon, with the price moving towards the targets. The closure of a daily candle above the invalidation level will invalidate this...
From the point where we marked start on the chart, MEW appears to be forming a bullish QM. As long as the green zone holds, it can move toward the targets. A 4-hour candle closing below the invalidation level will invalidate this pattern. For risk management, please don't forget stop loss and capital management When we reach the first target, save some profit...
IMX appears to be in a large wave B, which is forming a triangle. It is currently at the end of wave d of B. It is expected that upon touching the green zone, wave e of B will begin, pushing the price into a bullish phase. We are looking for buy/long positions in the green zone. A weekly candle closing below the invalidation level will invalidate this...
After the iCH formed on the chart, it seems we are in parts of wave C, which, after absorbing liquidity from lower areas, could push the price upward and complete the bullish segments of wave C. We are looking for buy/long positions around the green zone; however, reaching this area might take some time, so this asset should be kept on the watchlist. A daily...


