IMX appears to be in a large wave B, which is forming a triangle. It is currently at the end of wave d of B. It is expected that upon touching the green zone, wave e of B will begin, pushing the price into a bullish phase. We are looking for buy/long positions in the green zone. A weekly candle closing below the invalidation level will invalidate this...
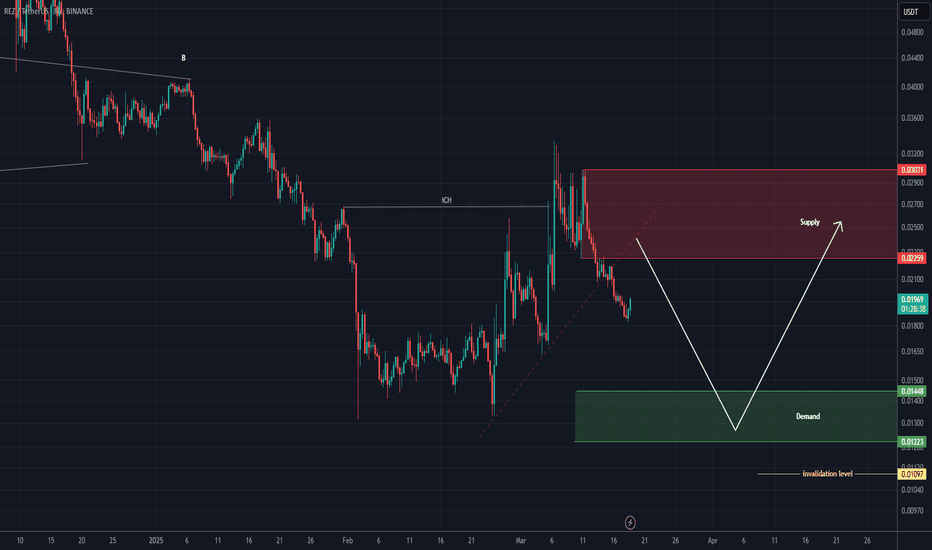
After the iCH formed on the chart, it seems we are in parts of wave C, which, after absorbing liquidity from lower areas, could push the price upward and complete the bullish segments of wave C. We are looking for buy/long positions around the green zone; however, reaching this area might take some time, so this asset should be kept on the watchlist. A daily...
This analysis is an update of the analysis you see in the "Related publications" section Considering the strength of the wave and the status of Bitcoin and other key indices, we have slightly lowered the support zone, as this coin may form a deeper correction for wave C. We have also updated the targets. Let’s see what happens. For risk management, please...
The MUBARAK correction seems to have started from the point where I placed the red arrow on the chart. The pattern could be a symmetrical, diametric, or expanding triangle. A strong demand zone lies ahead of the price, where we can look for buy/long positions. Targets are marked on the chart. A daily candle closing below the invalidation level will invalidate...
ONDO appears to be in wave D of a larger pattern (possibly a triangle). Wave D seems to be a diametric or symmetrical structure. This diametric may complete in the green zone, leading to an upward reversal. We are looking for buy/long positions in the green zone. Targets are marked on the chart. A daily candle closing below the invalidation level will...
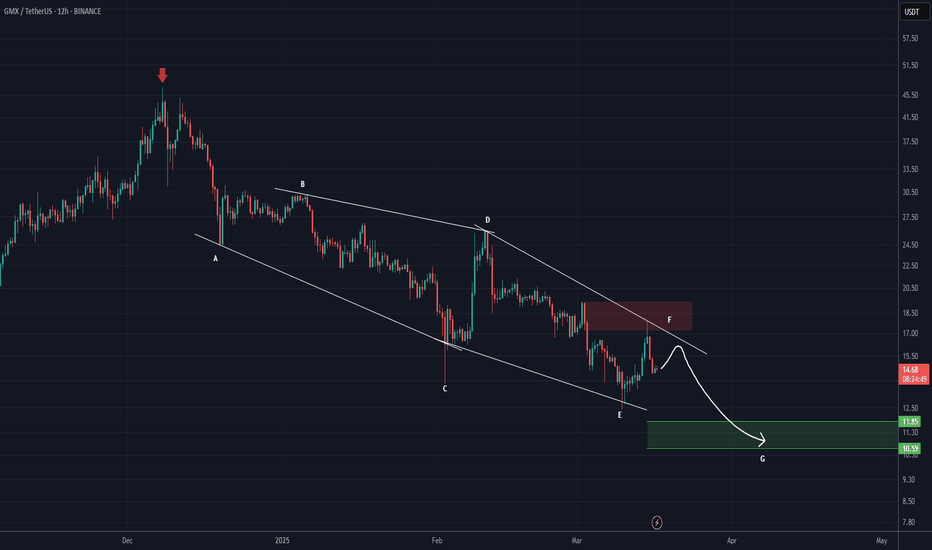
From the point where we placed a red arrow on the chart, it appears that GMX has entered a bearish diametric pattern. It now seems that wave F is nearing completion. The target is marked on the chart. it could be the green target box. If a daily candle closes above the upper red box, this analysis will be invalidated. For risk management, please don't forget...
From the point where we placed the red arrow on the chart, the RED correction has begun. It seems to be inside an ABC structure, and we are currently in wave C, which is bearish. A demand zone is visible on the chart, which could temporarily reject the price upward. Since wave B did not retrace more than 0.618 of wave A, it is expected that the low of wave A...
This analysis is an update of the analysis you see in the "Related publications" section The previous analysis scenario has expired, and this update's scenario is valid. Given the time correction of recent waves and the absence of sharp drops, this scenario for RED is valid, and buyers' footprints can be seen on the chart. We expect a strong rejection to the...
The correction of NEIROETH started from the point where we placed the red arrow on the chart. This correction appears to be a diametric pattern, and we are currently in wave f. Wave g could complete in the green zone, leading to the start of a bullish wave. The closure of a daily candle below the invalidation level will invalidate this analysis. For risk...
This analysis is an update of the analysis you see in the "Related publications" section This analysis is still valid. When everyone is discouraged and caught up in emotions, the BehDark team relies on the chart to publish analyses. We have also added a new target to the chart. Based on recent candles in the multi-timeframe, there is a possibility of reaching...
From the point where we placed the red arrow on the chart, the CKB correction has begun. It seems that CKB is in a bearish wave C. We have identified two entry points for rebuy, where a position can be taken in the spot market. A daily candle closing below the invalidation level will invalidate this analysis. For risk management, please don't forget stop loss...
The correction of MKR seems to have started from the point marked START on the chart. This correction appears to be a diametric pattern, and we are now in the late stages of wave F, which has been a bullish wave. It is expected that from the red zone, wave G a bearish wave will begin. The closure of a daily candle above the invalidation level will invalidate...
A significant trendline has been broken, and we have an iCH on the chart. Additionally, a key QM L has been reclaimed. With a pullback to the entry zones, we will be looking for buy/long positions. The targets are marked on the chart. A daily candle close below the invalidation level will invalidate this analysis. For risk management, please don't forget stop...
Two trigger lines have been broken, and there is a bullish iCH on the chart. We have also seen a strong move, and at the origin of this move, buy/long positions can be considered. This setup is mostly suitable for spot trading. Targets are marked on the chart. The closure of a 4-hour candle below the invalidation level will invalidate this analysis. For risk...
Given the structure formed at the price floor (3D), the mitigation of supply zones at the price ceiling, the sellers holding their ground, and the failure to clear key supply areas, the buyers who have pushed the price upward will likely turn into sellers around the red zone. This suggests that a significant drop is ahead. In reality, the price reaching these...
At the top of the chart, we have a liquidity pool, and behind this pool, there is an interchange zone, which is a supply area. In this zone, we are looking for sell/short positions. Additionally, below the price, a liquidity pool is currently forming, which is expected to break downward after collecting orders. Targets are marked on the chart. The closure of a...
This analysis is an update of the analysis you see in the "Related publications" section It seems to be forming a large diametric pattern. Currently, wave F is completing. Wave F is a bearish wave. Upon reaching the green zone, we expect the price to bounce upward. A weekly candle closing below the invalidation level will invalidate this analysis. For risk...
API3 has not issued a bearish trigger yet, but considering that it has hit a key resistance level, formed a base, and the base has been broken, it is expected that the price will be rejected downward during the pullback. We anticipate a drop from the red zone downward. Targets are marked on the chart. A 4-hour candle closing above the Invalidation Level will...


