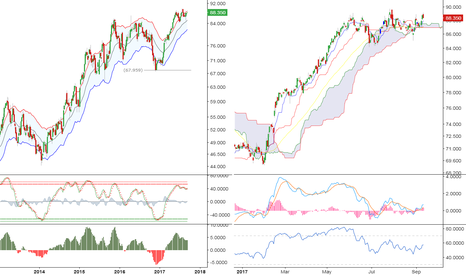
The long-term trend is completely intact and unchallenged. However, on the near term the outlook is a bit tiresome; bearish divergence and the lack of significant new highs suggests buyers are exhausted and a correction is around the corner. Tighten stops on existing longs or cover all together. New buying can be done if/once a deeper correction has occurred and...
The down trend is turning into a more neutral basing pattern. Bullish divergence and broader USD strength support this idea. Keep an eye out on the resistance area around 11.9045. Clearing this level triggers a recovery towards minimally 12.4515 and the pivots around 12.4810. With stops below 11.71 this setup gives a friendly risk/reward ratio of 2.81. Primary...
Compared to other major European markets, the Italian Government Bonds (IGB) have been quite bearish over the past two/three years. The recovery in early 2017 has not really altered the general trend. Moreover, now that the recovery and ensuing consolidation has petered out, sellers should make a new push lower once support at 99.77 is taken out. Bearish pressure...
The start of a correction is very likely after the completion of a Wave 5 bullish cycle. Weakness and divergence (weekly chart) is setting in just shy of the price projection at 1.6480. Dipping below 1.6190 signals the start of a correction back to 1.5870<>1.5790. Cover longs and/or enter short if your risk appetite allows for it. Primary trend:...
A near term Head&Shoulder reversal pattern has been completed with today’s rally above 402. Prices should rally towards the pattern projection at 475 over the coming days and weeks. On the longer term, a large double bottom seems to pan out. For this pattern to become valid, prices need to clear ~625.
The current consolidation occurs with in the primary uptrend. Normally we would be quite bullish on such a stock, but the current flat correction is taking too long for comfort. Earlier attempts to make a push higher have not succeeded and the lack of demand while the broader market is flirting with new highs does not match the trend phase. With considerable...
The daily chart offers somewhat more upside potential if buyers manage to clear 390.50. A rally up to 410.25 and the main weekly projection around 448 is feasible. With stops below 375 risk/reward is certainly good enough for some trading long-entries. Do keep in mind that the weekly uptrend is quite mature so risks for the longer term are elevated.
The primary uptrend originating in early 2014 has dried up. The daily chart shows consolidation after a recent breakout failure. Sellers are almost certain to make a push below support at 86.85 and this trigger a bearish trend on the daily chart. Nothing exceptional about that by itself, however, such a downtrend will also mean a failure on the weekly trend. Such...
NG feels oddly strong today. Support has been found in the middle of the adjusted keltner bands as well as the lower part of the Cloud (not not visible here). No major signal by them selves, but the strong support on the weekly chart in combination with the current rally does suggest that at least a new push higher will be attempted. Worth a gamble? We think so,...
Although lacking somewhat within the miners sub-sector, risk/reward is very favourable for some long-term buying. The corrective pattern since mid-2016 has based out around the 76.4% retracement level, which is common for multi-year primary trend reversals. Obviously metal spot prices have been very strong lately, resulting in a fierce rally for various miners,...
With general market weakness (or exhaustion, if you like) we are focussing on new short-entries for the near term (1-3 months). PHIA ( EURONEXT:PHIA ) has shown a recent breakout failure followed by the setting of a new lower peak. We expect prices to take out the trigger at 31.25. The first target comes in at 29.55 and we suggest keeping stops tight at 32.15....
Lower peak in combination with death cross in the MA's make for a good short-entry for the next 1-3 months. A trigger can be used below 12400. Main target comes in at 11495 and stops should be maintained above 12730 (daily close). TVC:DAX
H&S reversal pattern at the end of a long uptrend in combination with broader market weakness (including semiconductors). Worth looking at for some short exposure. EURONEXT:ASM
A H&S reversal pattern has been completed on the daily chart. The target at 5370 comes in just below the 38.2% retracement (@5419). Keep stops tight at ~5770. No need to give the (manipulated) market too much leeway...
Nothing special or sexy, just a near term shorting opportunity with decent risk/reward
With general market weakness and a rapidly detiorating banking sector, we are looking for good short-entries. ABNAMRO offers excellent risk/reward opportunities for the next 2-5 months. EURONEXT:ABN
The following setup is valid for the daily and 4-hours intraday charts short-entry < 1.4600 SL @ 1.4860 T @ 1.39 NOTE: target may be lowered depending on future developments.


