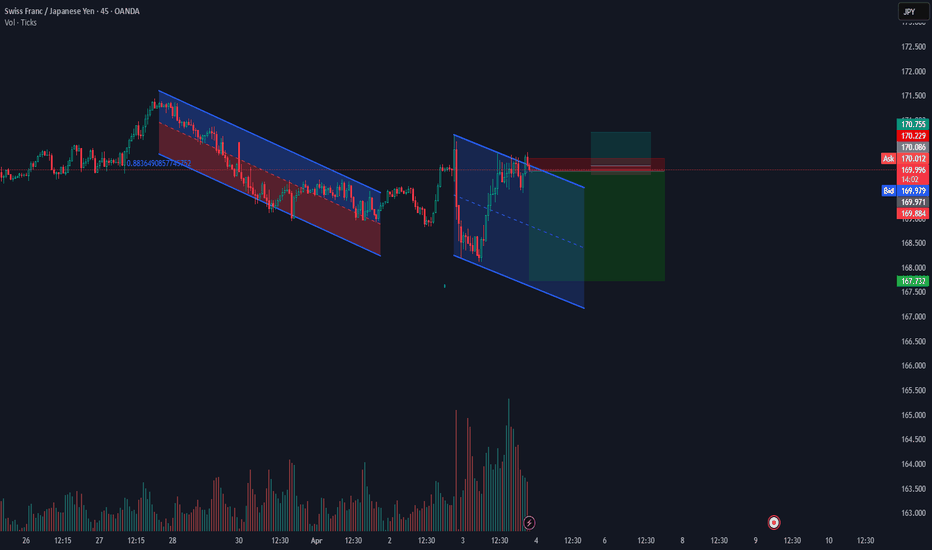
Trading a short term sell on GA. let see how it goes
it might come day, rebalance , then we resume the buy again. or BREAK TO the upside. However, volume indication shows sellers are stepping in
Potential short on CADJPY as the breakout and retest of a rising channel
In this parallel channel, I see the potential of a 250 pips drops in CJ. This is not a financial advice and all trading come with risk. the trade should have at least 20-30 pips Risk. Cheers
Retreating from its recent high, and using a channel confirmation as seen. the recent equal lows have been swept and price MIGHT be ready for more bullishness. NOT A FINANCIAL ADVICE.
Here is a breakout of a falling channel. We wait for the equal lows to be taken and then we buy
NZDUSD Multi-timeframe analysis (MTFA) I shall be using sharing my ideas from a supply and demand approach. From the monthly TF, we see a box pattern forming up and currently trending down within the box. Weekly TF shows the recent downtrend more clearly From the H4, i see a likely trend back into the resistance to take out the last high created before we...
FOMC stirred a massive move. A break of structure to the lower side will defeat the recent upward rally seen in GU. It is safe to look for entry at major fib reteacement
This is a recent 15RR game. Looking closely, we might go deeper in this correction
From a weekly TF perspective, GJ recently broke above a major resistant zone holding it down for more than 4 years. At the moment of writing, we see a retest of the broken zone in progress. If this plays out well, we might see GJ bullish price action for a larger fraction of the remaining days this year. GJ, what is next? Market leads, we follow. Gracias
In this chart, we see a down trending pair for the past few weeks. It is either we see a break of the WL (untested for months) and retest before further downslide or we reverse this strong downtrend at this level. Market leads, we follow.
USDCAD is in a simple uptrend. Another time to buy is now NB: Not a financial advice
In a daily chart, I can see a potential formation on USDCAD. If this come true, we see chances of buying this pair for a long term soon.
From a divergence and retest point of view, NZDCAD, has once again come into a demand zone and with hopes that the bulls can take it higher. NB: not a financial advice
the bearish divergence in the pair is occuring at an area of interest. Hoping to catch the move down shortly/ Trade safe. Not a financial advise
Will the low of the falling channel hold for lonnie or will it act as the long term support we think it should. USDCAd bounced off the low and presently retesting the support, if it hold, we go for the highs of the channel. trade safe Disclaimer: Not a financial advice.
USDCHF just reveal a divergence on the H4 tf. This is just an idea about a long time buy opportunity. Trade confirmation aligns with break of recent downtrend line. Trade safe. Disclaimer: Not a financial advise.
Having retraced back into recent broken resistance and now turn support, cadjpy seems ready for a buy. Sl n Tp as shown. Break above the recent high open room for HH, see you at the end NOT A FINANCIAL ADVICE


