Analysis using Elliott Wave Principle If this count correct, then corrective zigzag A-B-C(green) is completed, expect higher move which is impulsive wave iii (yellow) Two entry strategy Conservative waits until price move higher than the top of last wave 4 or the top of wave i. Aggressive enters when break white corrective resistance trend line Stop loss at...
Analysis based on Elliott wave principle Long opportunity spotted after the A-B-C zigzag correction. If this count correct then expect further upside movement which is wave 3 impulse. I highly expect price to reverse soon indicated by blue support line that coincides the 0.786 fibonacci retracement level and also RSI indicator shows a bullish divergence. Two...
MakerDAO came to a critical phase, whether it will break upside or make a lower low, but my elliottwave count sees a better upside opportunity. Stochastic is also building up a bullish divergence. Let's see what will happen next.
Zil/usd broken the flat corrective channel. I expect another bull continuation. The correction phase also landed beautifully on .618 fibonacci retracement level with W-X-Y structure.
XRPUSD breaks the Flat correction channel thus I expect the price to move upward to 0.185-0.19 resistance level
Here is the example of complex wave calculation based on elliott wave principle. Overall complex correction wave consists of 5 combined wave (w)-(x)-(y)-(x)-(z). These complex correction played out for very long period time thus can be very confusing. (w) wave is a zigzag of a-b-c, followed by triangle a-b-c-d-e (x), another zigzag a-b-c (y), followed by flat...
I noticed an irregular flat of wave 2- orange . As you can see the structure may have completed in (A)-(B)-(C), wave (B)- red warped higher than top of wave 1- orange , wave (C)- red also warped lower than wave (A)- red . If this correct, we might see a higher high as the price continue to complete the wave 3- orange and eventually complete higher degree of...
Based on Elliott Wave model, I expect the price to move upward. Price have done correcting with wave ii zig-zag correction of A-B-C, wave iii now in play, expect price to break the top of wave i. Since it broke the top of previous wave 4, the setup is complete, long position can be opened with stop loss at bottom of wave ii. I personally prefer to wait until...
As you can see from the Weekly chart, bear market might have ended for crude oil. With Elliott Wave model, i have counted the corrective wave started from July 2008 to mid April 2020( indicated by the oil crash event amidst pandemic). A complete zigzag corrective wave is done with prolonged ending diagonal of impulsive wave C. If this model is correct, then I...
1 hour chart shows a possible buy setup. Based on elliott wave principle. Wave 2 is ended with W-X-Y structure and nicely touch the 0.786 fibonacci retracement level. The price need to break peak of X wave to validate the counting. Plan Buy if break 1050 stop loss at 760. This idea is also supported with bullish divergence on RSI and stochastic. Cheers & god...
5 waves down is completed with RSI showing bullish divergence , expect future trend reversal. The big picture of the major correction may have ended in a complex W-X-Y structure. The plan is to enter long when price break 925 which is peak of wave b inside of wave 2. Stop loss is set at 600, the first target is at resistance level coincides previous peak of...
5 waves down is completed with diverging RSI, chance for a reversal uptrend. The plan is to open long positions if break the two lines: 1st at 1.885( breaking the wave 4 high) 2nd at 2.035 (breaking the wave b high, inside wave 2) Stop loss at 1.470. You can choose to manage the positions by your own money management. The first target is at the resistance level...
$ETH Wave 2 = double three W-X-Y (double zigzag). If correct then we are entering the bullish wave 3.
The major corrective movement ends the major wave (2) as the price reached 0.17 dollar in mid December. Now the price is entering major impulsive wave (3). Here comes the dissection... Wave (3) consists of (i)-(ii)-(iii)-(iv)-(v). As you can see from the chart, wave (i) is finished, we now expecting wave (ii) to play as a corrective move from impulsive (i). I...
This one I expected a continuation of an upward movement. The wave structure is indicating that the correction of wave C is over indicated by clean retracement to the 0.382 fibonacci level, now the chart is pretty much bull and suppose to retest the level of B, 0.86xxx. Hopefully it also end the higher degree correction, wave (2).
As you can see in the posted chart, the pair will eventually goes down after the completion of triangle pattern (3-3-3-3-3). The blue box indicates the next target level of last movement of (e) wave. This analysis is just one possibility of many scenario, but for me, it is the most anticipated and preferable scenario. Let's see how it will be played out.
GBPAUD made a breakout signal indicating a bull continuation. From From image above (the 4 hour time frame chart), the pair confidently break white resistance trend line as the stochastic indicators also confirm the bull continuation. Pixel trend indicator also gives all green color which is pretty save to get in for now. Personally this is a perfect setup for...
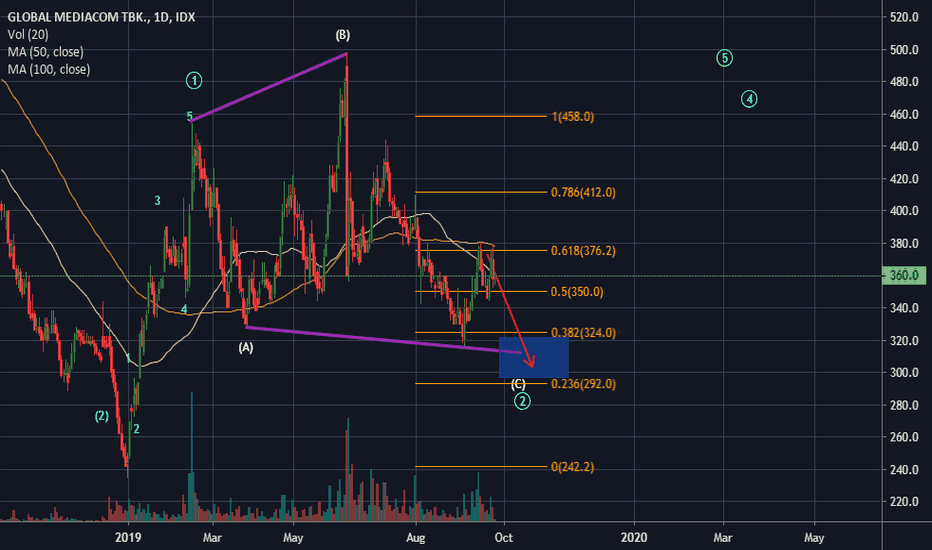
BMTR Global Mediacom Tbk. Based on Elliot Wave theory, the weekly time frame chart indicate a completed major correction of wave (2) which is a triple zigzag correction . We can add this to our watch list to see if it really confirm to resume its upward movement of wave 3. If we stick to the previous counting, the daily chart provide more detailing...


