GBPAUD made a breakout signal indicating a bull continuation. From From image above (the 4 hour time frame chart), the pair confidently break white resistance trend line as the stochastic indicators also confirm the bull continuation. Pixel trend indicator also gives all green color which is pretty save to get in for now. Personally this is a perfect setup for...
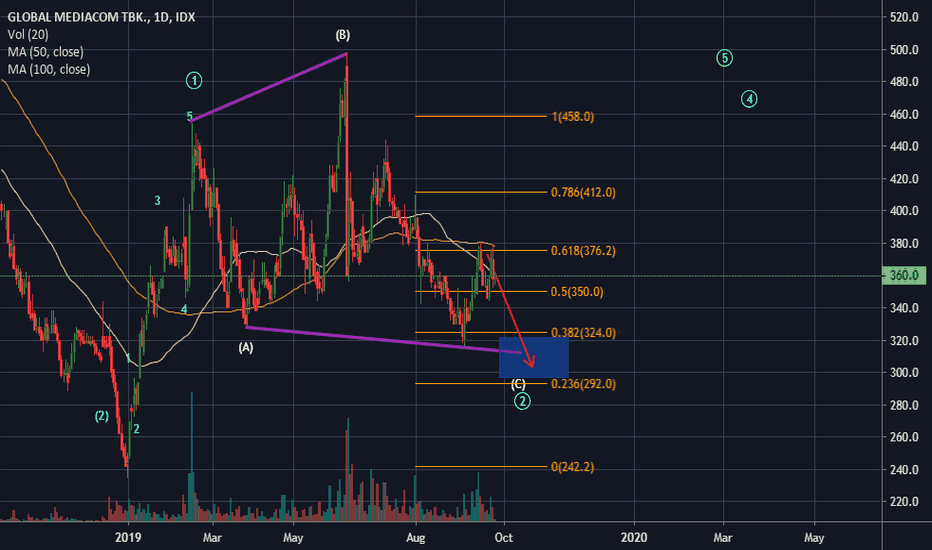
BMTR Global Mediacom Tbk. Based on Elliot Wave theory, the weekly time frame chart indicate a completed major correction of wave (2) which is a triple zigzag correction . We can add this to our watch list to see if it really confirm to resume its upward movement of wave 3. If we stick to the previous counting, the daily chart provide more detailing...
Ripple/USD Hello Guys, this is my technical analysis of ripple/usd using only Elliot Waves theories, though not so advance, but I hope it can give you some inspiration and maybe a bit fortune. As you can see, I assume 14 Aug '18 is the lowest price at .24646 then we can start count wave 1 as an impulse wave ending at 0.80000 usd. Next comes the correction wave...
Silver probably still have a good chance to continue moving upward. As you can see on the picture, now XAGUSD is still in correction phase, apparently there also still more chance for it to go down deeper to complete wave C(white) There is blue line which I set to be my resistance line to mark wether the correction is done. If it goes up and break the line then...
Here is my big picture of NATGASUSD, we are in the correction wave 2 of a bigger wave C, as u can see Natural gas reach the blue strong resistance line and will be bounce to the support line bellow it, apparently this could rather ends the wave 2, and be the start of impulsive wave 3 to the downside. The next target is around 2.794 and possibly break the blue...
Clear ABC correction which is not a reversal for bullish. If it break the yellow line, consider short term selling, but do with your own risk management. God bless u all, have a nice day...


