Total Market cap of all crypto is 270 Billion as Im looking at the chart on 2/6/20. We surpassed the previous resistance of 250 Billion on January 28th...and now our next resistance is at 300 Billion...but we are also forming a golden cross and looking back at history, when the previous golden cross occurred April 19th 2019 we went on a 130% upward tare in market...
From November 25th to Jan 2nd we were in a nice accumulation faze on the daily chart. Starting Jan 3rd the up trend started. We are now at around 9.6k with no resistance until we get to around 10.5k. If we get to 10.5k we may easily break through that resistance because what it looks like forming is a "Golden Cross" not just any golden cross but the alpha and...
STRATIS is a cool project. I've been following them for a while. They have a great team and like clockwork always come out with new products on time and as promised. In my opinion they are one of the most undervalued coins out there at the moment. With an all time high around 24 dollars per coin this coin has potential to make big moves and rapidly! Right now...
Weekly candle charts are more accurate than daily candle charts, monthly are better than weekly and so on and so forth. Here we are looking at the monthly. We see something very nice. We see higher lows! It looks like we are on our way to retest 517 (our previous high) If we go over 517 or rather 520 (the crowd likes nice round numbers) then according to the...
300 Just has a good ring to. It is a nice round number. Human behavior will probably demonstrate that all the sellers at around 400 will wanna get back in at 300 therefor it may act as a nice support, there's gonna be some wild volatility and volume around that price rest assured. This is the most likely scenario BUT, there is a BUT. As I always say trading is a...
if we stay above 8500 and gain some confidence we will most likely go to 9200
IF WE BREAK 235 WE ARE MOST LIKELY HEADING TO 315, LOOK AT CHART FOR MORE INFO. TRADING IS A PROBABILITY GAME FOLKS...
WHAT WILL MOST LIKELY HAPPEN At the time of writing this Bitcoin is at 5580, At the same area is the 50 day Moving Average, the 2nd strongest MA in technical analysis. The 50 day MA acts as a resistance line right now, in order for the price to advance the price has to go over the resistance (50 day MA) if it does we will most likely go to 6300 before we hit...
Here we are doing some good ole fashioned Technical Analysis. Why are we looking at the weekly chart. The daily chart is more accurate then the 1 hour chart, and the weekly is more accurate then the daily chart and so on and so forth. Here we can see that there is a channel between 3.1k and 4.2k, meaning that the prices move up and down in what traders call a...
Chain link forming a head n shoulder with a 9 forming on the support line via Thomas DeMarks sequential indicator....easy 12 - 15 percent gain before it tanks?
Bull Market Initiate! Broke 4hr Resistance! Broke Daily Resistance! Broke Monthly Resistance! 30k here we come.
Bill Williams Trading strategy is saying that if candle 4 closes above that dotted line, BTC price will go up. If you dont't know Bill Williams look him up. Interesting fellow.
BTC is finally making other moves besides down, we under brown trend lines which is representing weekly trend, shows us where resistance price is. Red trend lines represent the daily candles...showing us support. Blue = the 4hr candle trend line... on 4hr chart if new candle closes under blue resistance line we will probably go down to red support trend line and...
Is it weird that the price of Bitcoin went up during the first match of the FIFA World Cup in Russia? This was a perfect opportunity for whales to make heaps of money while many people around the world weren't paying attention to their investment. What are your thoughts?
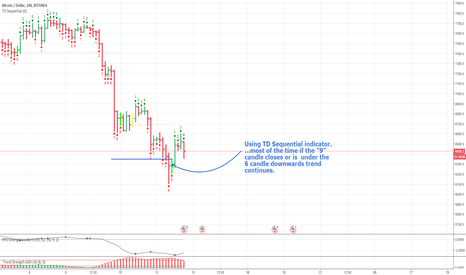
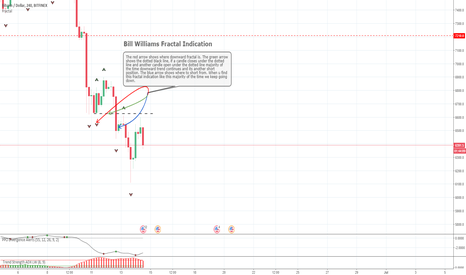
Using a Thomas DeMark indicator we are shown that we will keep going down...the Bill Williams Fractal indicator already confirmed ut too...so there's two indicators showing we are going downwards with BTC, we need to test with one more indicator to see if this is true, at least that is what they say
Hi, I am a noob learning TA, according to my research on Bill Williams and fractals BTC will continue going down. I don't suggest you make any trades based on my TA as I am still learning. But follow me if you wanna give me advice or if you are a noob too and just wanna learn or mess around with different indicators.


