One can buy HCL when a candle gives a close above 1146.75 on 15 minutes chart with a stoploss of 1142.5 or if price closes below the yellow EMA line and keep riding or if one wants to fix their target they can use fibbonacci on the candle that gave breakout above the range.
Earlier Divergence strategy had already given short signal on its daily chart there stoploss was above 80, now this strategy would give a short signal on this 15 minute chart once on monday in first 15 minute candle closes below the low of current candle and then the stop loss would be above 77.5 or close above green line whichever comes first, else just keep...
short with the stop above 586.1 or untill it closes above green line, short at the open itself and ride untill you hit the stoploss or use fibonacci on the candle breaking down from the lines to set targets for yourself as per your risk I usually ride untill it hits my stop.
Once a candle gives a close below low of the candle that has broken down below the channel one can go short and keep riding untill it closes above green EMA line, be watchful of this opportunity
It has an interesting chart pattern on 15 minutes chart, it has given a break down below the neckline of evident double top pattern, now interesting thing is if a candle goes below the low of the candle that broke below the 2 ema lines and closes below it then its another indicator making a case for short and the first target on down side would be of 410 though...
A Bearish Flag Pattern break down is already given and also its trading below the double EMA lines which confirms the down trend, one could go short with a minimum targets of around 375 before it hits the stoploss, i.e. close above the bearish flag pattern or close above the green ema line which ever comes first else ride the down trend it can give you massive gains .
Watch this counter closely It might give you an apt oppotunity to short once 2 candles close below yellow line on 15 mminutes chart or if the candle jumps down below and closes below the yellow line you can short it at the open of next candle itself.
One can go long on indusind bank here since it has given close above the green ema line and one can stay in the trade untill it closes below the yellow line, these lines are basically made with 48 period ema of highs and lows. This is something new that I have learnt. you can backtest yourself if you have doubts. Its just my view on this strategy
Its such a beautiful pattern, price is stuck between overhead long term trend line and short term trendline and the indicators are showing bearish divergence, this could be a huge winner for the shorters
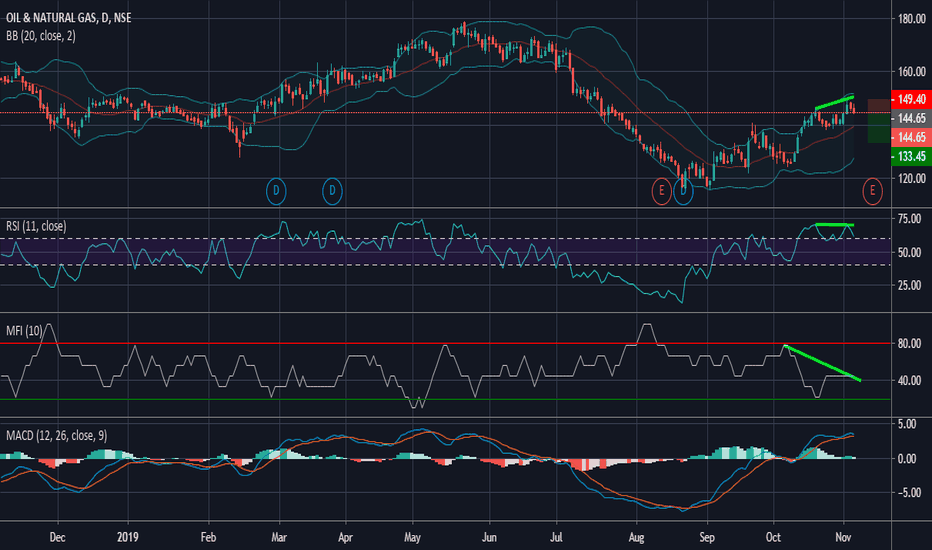
Short this counter once MACD turns negative, aggresive traders can short right away since there is divergence on RSI , MFI and volatility
This trade has got 1:1 risk reward, so only aggressive traders should take this trade that too with less quantity, it is showing divergences on RSI MFI and Bollinger, and MACD slope has also started to turn so one can go short here or on a bounce back
One can go short on this counter once it gives close below 649 for the target of 602 and a stoploss of 674.8, once it closes below 649 it will be breaking neckline of double top pattern and also a break down below descending triangle.
IOC has formed triple top pattern on daily charts and broken the neckline , one can take this trade as risk reward is 1:3 in this case
HDFC has made lower highs and stochastic is making new high, this shows hidden bearish divergence, plus HDFC is also near its resistence zone, so one should avoid going long rather short it using at the money put option
There is bearish divergence on RSI , MFI when price made new high, according to me one should go short once MACD turns negative for the minimum targets of 1452, or one can go short immediately with the stop of 1615 as if seens closely MACD line has started to turn
Axis Bank is trading near a resistance on 4 hour chart and already showing divergence on RSI and MFI, as soon as MACD turns negative one can go short, however agressive trader can go short even if just the slope turns downwards
stochastic and MFI have already shown divergence if MACD confirms in next few candles on 4 hour chart then one can go short
It is breaking down below symmetrical triangle pattern on daily chart, watchout for close below 1236, then one can carry their shorts , avoid going long for now.


