elitetrader9090
Gold (XAU/USD) Analysis This chart provides a technical outlook on **Gold (XAU/USD)**, showing possible **bullish** and **bearish** scenarios based on price action and support/resistance levels. Bullish Outlook Key Support Holding**: Gold is staying above **$3,125-$3,130**, showing buyers are stepping in. - **Uptrend Structure**: Price is following a rising...
Gold (XAU/USD) Scenarios *Market Overview:* - Gold is currently trading around *$3,132.70*, maintaining its upward trajectory. - The price remains *above key moving averages* (7, 21, and 50 EMA), signaling ongoing bullish strength. *Critical Price Levels:* - *Resistance Zone ($3,140-$3,145):* Price has tested this level but hasn’t managed to break...
Gold (XAU/USD) Technical Analysis #### **Current Market Overview** - **Price:** $3,092 - **Support Level:** $3,087 - $3,083 - **Resistance Level:** $3,095 - $3,100 - **Trend:** Uptrend continuation, with price holding above key EMAs --- ### **📈 Bullish Scenario** - If the price **breaks above $3,095 - $3,100** resistance, expect further upside...
Gold (XAU/USD) Trading Strategy **📈 Bullish Strategy (Long Trade)** **Entry:** - Look for a **bounce** from the **$3,071 - $3,072 support zone** or **$3,063 S2 support level**. - Confirmation signals: - A **bullish candlestick pattern** (e.g., engulfing or pin bar) near support. - Price holds above **7 EMA ($3,071)** and **21 EMA ($3,063)**. ...
**Gold (XAU/USD) Technical Analysis – 1H Chart** **Current Price:** ~$3,018.51 **Resistance Levels:** ~$3,030, ~$3,045 **Support Levels:** ~$3,010, ~$2,995 *📈 Bullish Scenario:** - **Break Above Resistance (~$3,030-$3,045):** A sustained move above the nearest resistance zone could push gold toward $3,050 and beyond. - **Moving Averages Support:** If...
**Taming Greed: The Secret to Long-Term Trading Success** Trading is a battlefield of emotions—**excitement, fear, hope, and greed**. Among them, **greed is the silent killer**, pushing traders to overtrade, overleverage, and chase the market, ultimately leading to disaster. As the saying goes: 📉 **“Bulls make money, bears make money, but pigs get...
Trade Setup for Descending Channel in XAU/USD (Gold) **📉 Bearish Trade Setup (Sell Strategy)** Since the price is trending within a descending channel, the best trade approach is to **sell at resistance** and **target support levels**. **📌 Entry Points:** 🔹 **Sell Entry #1:** Near the upper boundary of the descending channel (~3,020 - 3,030). 🔹 **Sell...
Gold (XAU/USD) Head & Shoulder Chart Pattern **Bearish Breakdown Confirmation (📉 Downtrend Risk)** - **Head & Shoulders Breakdown:** The price formed a **head and shoulders pattern**, signaling a potential reversal. - **Sell Zone:** Price is trading below the **21 EMA ($3,027)** and **7 EMA ($3,028)**, confirming bearish pressure. - **Support Test:** Price is...
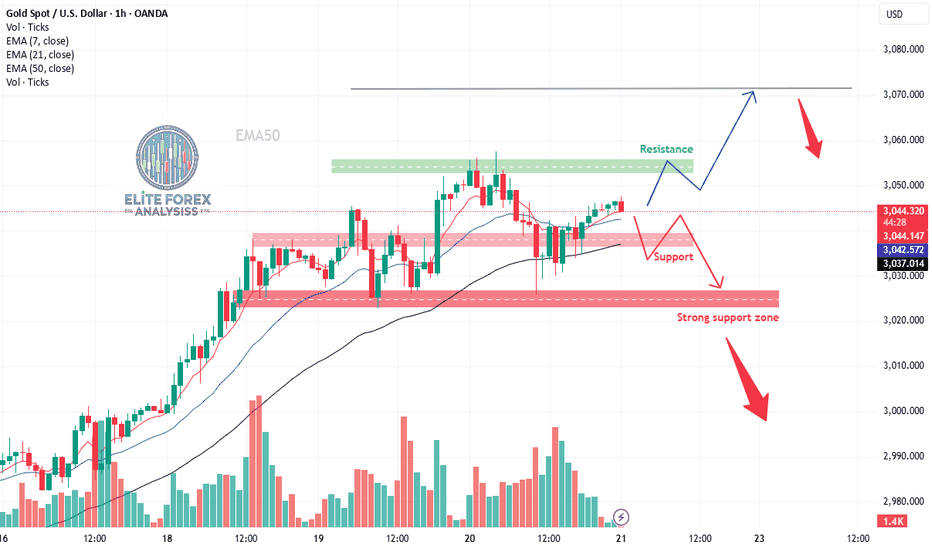
Gold (XAU/USD) H1 Chart Analysis with D1 Doji Candlestick Insight 1. **Resistance Zone ($3,050 - $3,060)** - Gold is currently testing a **resistance level** around $3,050. - A clear **break and hold above this level** could push prices towards $3,070 or higher. 2. **Support Levels to Watch:** - **Immediate support:** $3,040 (near 21 EMA) -...
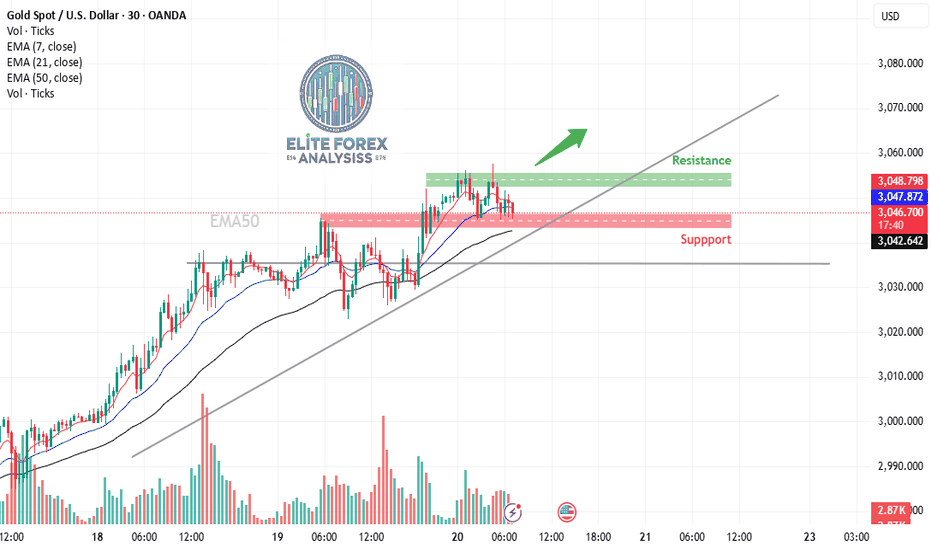
**1. Trend Analysis (Bullish setup) - The price is currently in an **uptrend**, confirmed by the **higher highs and higher lows**. - The **ascending trendline** acts as a dynamic support level. - The **price is above the 50 EMA**, which usually signals a bullish trend. - However, it's currently testing support, and a break below could shift momentum. **2. Key...
Gold (XAU/USD) Chart Analysis **Key Observations:** 1. **Current Price & Trend:** - Gold is trading around **$3,033-$3,034**, showing a slight pullback after a strong rally. - The trend remains **bullish**, supported by key moving averages. 2. **Support & Resistance Zones:** - **Resistance Zone (Green):** - **$3,040 - $3,044:** Minor...
**Analysis of USD/JPY Chart** **Chart Pattern & Market Structure** - The chart identifies a **triangle chart pattern**, which often signals a potential breakout. - Price has been consolidating within this structure and recently **broke above the pattern**, indicating possible bullish momentum. **Key Technical Levels** - **Resistance Zone (~149.8 -...
**Gold (XAU/USD) Chart Analysis** 📌 **Current Price:** $3,014.41 📊 **Chart Pattern:** Uptrend with Higher Highs & Higher Lows 🎯 **Short-Term Target:** $3,020 **🔹 Key Levels:** - **Support:** - $3,012 (7 EMA) - $3,008 (21 EMA) - $3,003 (50 EMA) - **Resistance:** - $3,015 (Immediate) - $3,020 (Psychological Level) **✅ Trade Setup...
AUD/JPY Chart Analysis **Key Patterns Identified:** 1. **Rectangle Pattern (Range-bound Market)** - The price traded within a horizontal range, forming a consolidation zone. - Two clear support touches at the bottom of the range (labeled as Bottom 1 and Bottom 2). - The price respected both support and resistance levels multiple times before breaking...
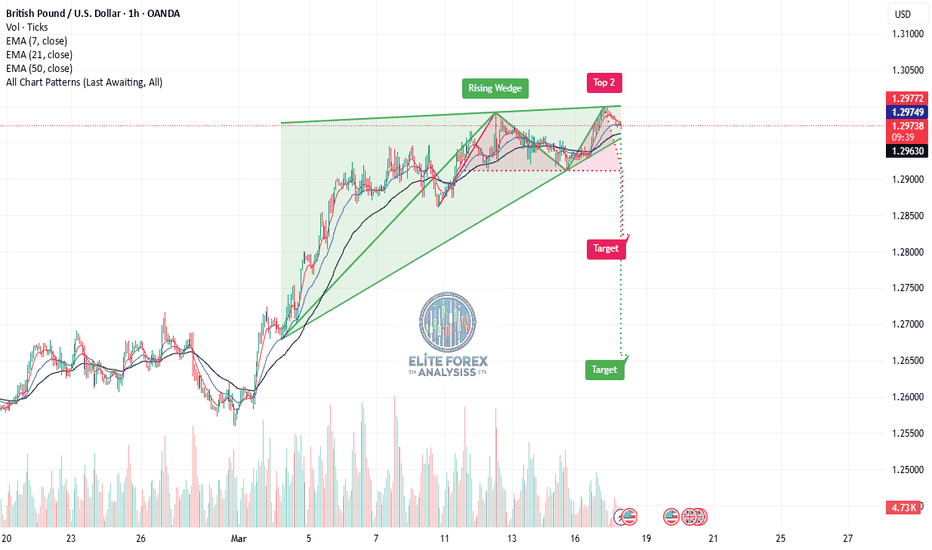
**Chart Analysis: GBP/USD (1H Timeframe)** **1. Chart Pattern - Rising Wedge 📉** - The price has formed a **rising wedge**, a bearish reversal pattern. - A rising wedge occurs when price makes higher highs and higher lows but within a narrowing range, suggesting weakening bullish momentum. - The price has now broken out of the wedge, signaling a potential...
**GBP/USD Market Outlook & Analysis** **📊 Price Action & Key Levels** - **GBP/USD trades around 1.29300** in a narrow range, struggling for momentum. - Last week’s **high of 1.29900** remains a key resistance level. - **Key Support Levels:** - **1.29000 (Psychological level)** → A breakdown may trigger more downside. - **1.2850 (Next key...
Gold ( OANDA:XAUUSD ) Market Update Bullish #### **Current Trend: Bullish** - Gold has been in an **uptrend**, trading near the **$2,990 level**. - Price remains **above key moving averages (EMAs)**, which signals continued buying pressure. - The market is consolidating after a strong rally, meaning traders are taking a breather before the next move. #### **Key...
**📈 Gold (XAU/USD) – Head & Shoulders Pattern Analysis** This chart represents the **Gold Spot (XAU/USD) 1-hour timeframe** and shows a potential **Head and Shoulders (H&S) pattern**, which is a bearish reversal signal. Let's break it down: **🛠 Key Elements of the Chart:** 1. **📉 Head & Shoulders Formation (Bearish Sign)** - **Left Shoulder**: Price...


