elitetrader9090
**GBP/JPY 15-minute chart** **Trade Analysis & Idea:** 📉 **Previous Downtrend**: The pair experienced a strong drop before finding support around **191.400**. 📈 **Current Recovery**: Price is now rebounding and trading above short-term moving averages (blue & red EMA). 🔄 **Resistance Zone**: The **192.000 - 192.200** area may act as resistance for further...
**Gold (XAU/USD) Trade Plan** 🏆 📌 **Key Levels:** - **Support:** $2978 - **Resistance:** $2991 📈 **Bullish Scenario (Breakout Above $2991)** - **Buy Entry:** After a strong breakout with confirmation. - **Take Profits:** - **TP1:** $2996 - **TP2:** $3001 - **TP3:** $3005 - **Indicator Confirmation:** EMA 20 for trend strength. 📉...
**GBP/USD Trade Analysis** 📊 **Current Price:** 1.29300 📈 **Bullish Scenario:** - **Buy above:** 1.29400 - **Target 1:** 1.29600 - **Target 2:** 1.29800 - **Stop Loss:** 1.29150 📉 **Bearish Scenario:** - **Sell below:** 1.29150 - **Target 1:** 1.29000 - **Target 2:** 1.28800 - **Stop Loss:** 1.29400 📌 **Key Levels:** -...
**Gold (XAU/USD). ### **Key Observations:** ✔ **Uptrend Strength:** Gold had a strong bullish move earlier, with a notable spike in volume. ✔ **Support & Resistance:** - **Immediate support:** Around **$2,932 - $2,928** (black moving average line). - **Resistance:** Around **$2,936 - $2,940**, where price struggled to break higher. ✔ **Moving...
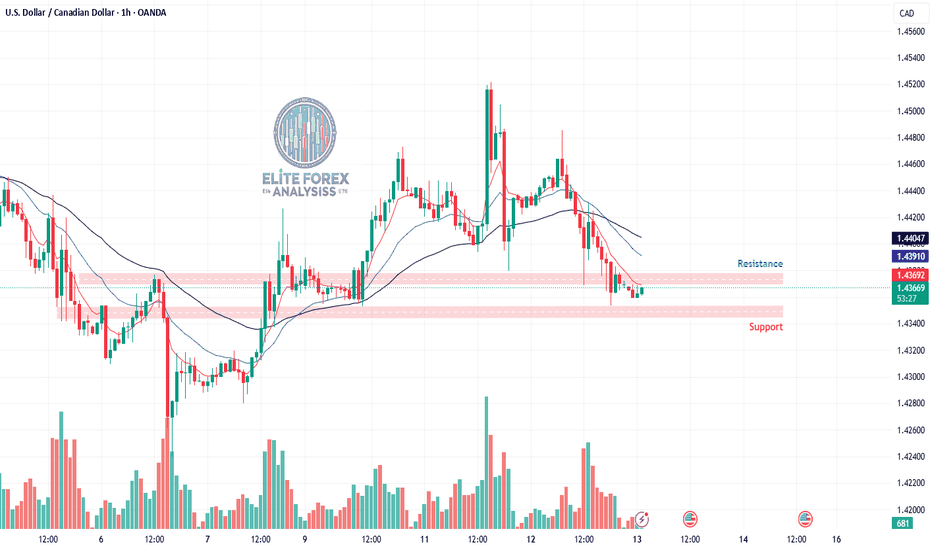
**USDCAD Trade Idea (1H Chart Analysis)** **Market Structure:** - The price is in a **downtrend** on the 1H chart, with lower highs and lower lows forming. - It is currently testing a **key support level** around **1.4350**. - The **50 EMA (black line) is above the price**, confirming bearish momentum. - The recent candles show **decreasing volume**,...
**Gold (XAU/USD) Trade Idea** **📊 Current Market Overview:** - Price: **$2,912** (as per chart) - Key Resistance: **$2,920 - $2,932** - Key Support: **$2,900 - $2,888** - Moving Averages: Price is hovering near the 50 EMA and 20 EMA, showing a potential decision point. --- ### **📈 Bullish Scenario:** ✔ **Entry:** Buy above **$2,915** after...
EUR/JPY chart shows a strong bullish breakout after a period of consolidation. ### **📊 EUR/JPY Trade Outlook** 🔹 **Current Price:** 160.600 🔹 **Resistance Zone:** Near **161.000** 🔹 **Support Levels:** **160.132**, **159.797** ### **Key Observations:** ✅ Price broke above consolidation with strong bullish momentum. ✅ Moving averages indicate an...
The current price of **XAU/USD (Gold)** is **$2,885**. This level is near a significant support zone, which could influence future price movements. **Key Levels to Watch:** - **Support:** - **$2,878**: A deeper pullback could test this level. - **Resistance:** - **$2,8950**: If gold rebounds, this is the first level to break. **Potential Scenarios:** -...
GBP/USD 15-Minute Chart Analysis & Trade Setup 📊 Trade Setup Idea 🟢 Bullish Scenario (Long Entry) Entry: Above 1.29050 (if price sustains & closes above) Target 1: 1.29400 Target 2: 1.29800 (if strong breakout) Stop Loss: Below 1.28600 (tight SL for risk control) ✅ Confirmation: Look for a retest of 1.29050 as support before entry **Key Observations:** 1....
Bullish Continuation Pattern, Bullish Flag 🔹 Bullish Flag – The price had a strong upward move, followed by a slight consolidation. If it breaks above resistance, it could continue the uptrend. 📊 Key Levels to Watch: Target 1.57000 Stop Loss 1.55300 Support: Around 1.555 Resistance: Around 1.561 - 1.565 If price breaks above resistance with volume, it could...
Support Retest / Pullback - The price recently bounced from around **1.28970 (black EMA). - If it holds above this level, the uptrend may continue. - A break below **1.28950 might indicate further downside. ### **📌 Trading Strategy** ✔️ **Bullish Bias:** Buy if price breaks above **1.29200, targets **1.29400 - 1.29600. ✔️ **Bearish...
This EURCAD chart shows a **Bullish Flag Pattern**, as indicated on the chart. **Key Observations:** - **Bullish Flag Pattern**: This is a continuation pattern that typically signals a potential upward breakout after consolidation. - **Resistance Zone**: Around **1.56200 - 1.56400**. - **Support Zone**: Around **1.55600 - 1.55700**. - **Moving Averages**:...
**The Steps to Identify Key Levels on Chart:** 1. **Support & Resistance:** - Identify areas where the price has bounced multiple times. - Based on your chart, key **support** seems around **2900**, while **resistance** could be near **2925-2930**. 2. **Trendlines:** - Check if highs/lows are forming a triangle pattern. - If lower highs...
EUR/JPY trade setup is based on a **bullish breakout strategy**. Here’s a breakdown of the analysis: **🔹 Trade Details:** - **Entry at 160.200:** This level is identified as a good buying point, likely after a breakout or strong upward momentum. - **Stop Loss at 159.500:** If the price reverses and hits this level, the trade will be closed to limit...
EUR/GBP Trade Analysis & Key Levels 📈 **Current Price:** 0.83800 🔹 **Resistance:** 0.83900 🔹 **Support:** 0.83700 💡 **Market Outlook:** - Strong **bullish momentum** observed, supported by the **EMA50** trend. - If the price **breaks resistance**, the next target is **0.84600**. - If the price **breaks support**, a bearish move may follow. 🎯...
### **📊 Gold (XAU/USD) Chart Analysis** 🔹 **Current Trend:** Bullish momentum continues after two strong bullish days. 🔹 **Key Indicator:** RSI trending in bullish territory. ### **🔺 Bullish Scenario (Buy Trade)** - **Next Resistance:** $2,950 - **Major Resistance:** Record high at $2,954 - **Breakout Target:** If $2,954 is broken, gold could reach...
### **📢 EUR/USD Trade Setup: Long Position with EMA50 Confirmation 🚀** EUR/USD is currently showing **bullish momentum**, supported by the **EMA50 trend**. A **long position** is suggested with a well-defined **entry, stop loss, and target levels**. --- ### **🔹 Trade Details:** 📍 **Entry Point:** **1.06800** (Buy) 🎯 **Target Price (TP):** **1.08000**...
### **📢 GOLD Trade Alert: Buy Now at 2917 🚀** 📍 **Entry:** **2917** (Buy) 🎯 **Take Profit Targets:** ✅ **TP1:** **2925** (+80 pips) ✅ **TP2:** **2930** (+130 pips) ✅ **TP3:** **2935** (+180 pips) 🛑 **Stop Loss:** **2908** (-90 pips) 📉 **Support Level:** **2915** (If price holds, bullish momentum is strong) 📈 **Resistance Level:** **2920**...


