Check any resistance and supports using Fibonacci. 8316 is main resistance level.
Established sling shot fibonacci pattern. Sell stop points are 1) upward 0.236 fan line or 2) 60.70/61.80%
This day trading set up will help where are supports and resistances level on this 15 min chart.
Doubled resistance lines are placed on above. Looks hard to go through up.
Even heavy adjustment against sharp rising, crude oil will be likely to go up. But 61.88 is a resistance level and let's see this will go over 61.88.
Check 1st support and 2nd support on this falling.
3 white soldiers pattern created. Achieved 1st up wave max level, 32.63/423.60%. Now is going up to next target 2nd up wave max, 38~40 around? Once touched 2nd up wave max, will see adjustment. Good luck.
Will touch soon Fibo fan line level 0.236 and that will be a bouncing point.
5.7/423.60% is a resistance level in area. Be careful.
Looks touched bottom and will be likely to go high.
If down more, up-arrow marked area will be an expected bouncing point.
Touched support level 103.25/61.80%. Let's see next day's move.
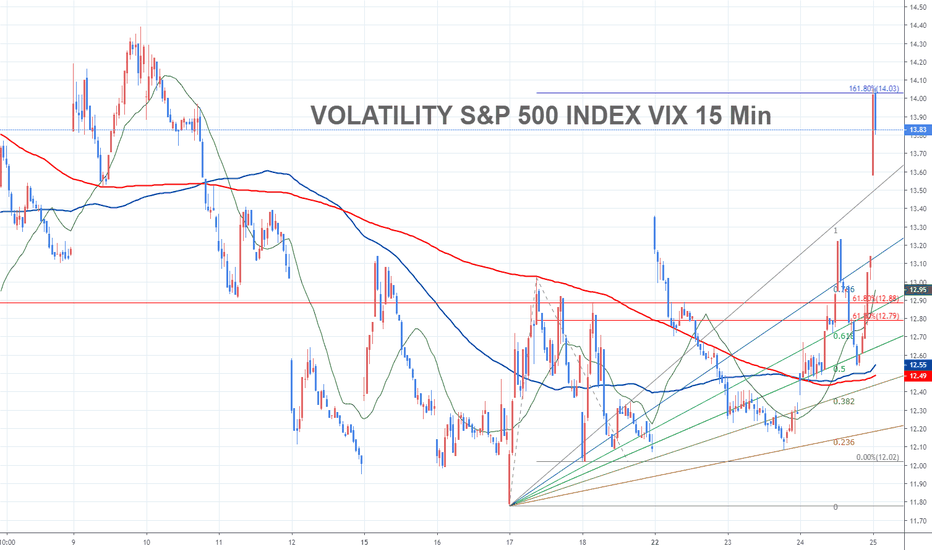
I think VIX will go up more and reliable support level is 12.79 ~ 12.91. Check this.
14.03/161.80% is a resistance point. Once break over this level, next target is 15.23.


