fmanning
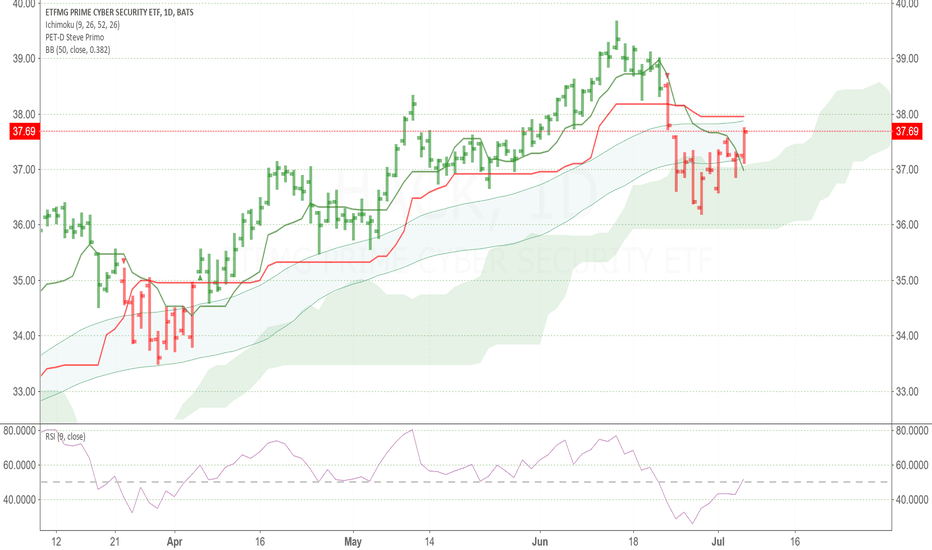
HACK: 1) Long term Bullish, see weekly chart 2) Short term Bearich, but have bottomed out: Why a) 50/50 RSI is about to cross from below upwards b) Prices have break through the kumo-cloud c) prices closed at the top 25% of range on 2 consecutive bar d) Indicators are all labelled red Action: I will go long when all of the following are lined up:...
Positives 1) Weekly on a strong up trend 2) Daily is on a declining up trend Negative: 1) RSI is above 50 (average gain > average loss) ,but this is declining 2) Negative momentum Action: Wait for : 1) a positive RSI above 50 ( this means average gain> average loss and increasing) 2) Prices are above the cloud ( this shows a strong Bullish short-term trend)...


