13 and 9 print on Cable. Buy with stop below 1.31. Excellent entry on swing failure pattern too.
We have a Demark 9 Sequential print in the LEI with a Shooting Star candle the following period (this is a Quarterly chart). I think this shows that the current business cycle has peaked. S&P500/FTSE to nose dive within the next 3-12 months.
Looks like we have a selling climax in Soy Beans. I'm a buyer here with a stop below 3.25. I would expect a 2nd test of the low, so for a lower risk entry await the 123 (ie a higher low) to get in.
DXY has posted a weekly bullish engulfing bar, but also a Demark 9 Sequential sell set-up. I would sell this back below the weekly bull candle at 93. The Feds are hiking rates - rate hikes are yield increases. Yield up, prices down. This is nothing more than summer bear flag!!
Buy above 23.34 on DeMark 13 Buy Countdown.
DeMark 13 countdown (after 9 sequential) print buy signal for LTCUSD. Buy above the 13 bar high with stop loss below the low.
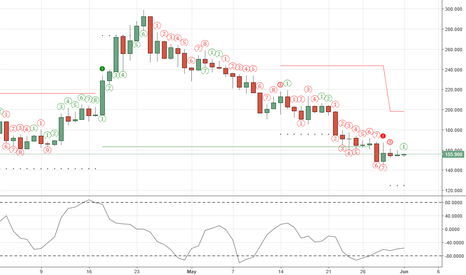
Long above 162 above the first bullish flip No 1 bat high after a TD Sequential 9 print on the daily. Many CFX pairs are showing similar set-ups which point to a wider rally across the Crypto space building. Buy
WTI (Crude) is a big sell. Monthly Shooting Star and Demark 9 Sequential count. Should see this continue to fall for the next few months. OPEC next month but Rus and Saudi have indicated that they are happy with lower prices too.
Sell short now that we have broken below the bearish Flip after a 13 Demark Countdown print. We have also broken below the major up trendline. Sell.
Weekly Demark 13 countdown sell entry now activated with the lower breach of the No1 of an opposing buy set-up. Sell with target of $47.00. Less aggressive entry is below the '13' bar at $63.70 - same target. Enjoy.
TD Sequential 9 print, buy set-up; Long above the first opposing No1 bar high.
We have a DeMark 13 countdown sell today in DXY so expect the USD rally to end within the next 1-18 days. I would sell DXY below the low of the 13 print if we close here today.
Buy above 1.3340 on DeMark 13 Countdown buy set-up. DXY is overbought and also shows a 13.
We have a DM 13 Sell Countdown print in the iShares Min Volatility ETF which could portend higher equity vola ahead. I would sell below the 13 print low.
From this chart it would appear that the Eurodollar market (NOT EURUSD, but the offshore USD market) acts as a good leading indicator for the stock market with a good lead. The last peak was 2015 which suggests recession within 4 years so it fits with the 2018/19 recession narrative. We have also seen a peak in M2/BLS Raw Industrials which is the first market to...
Long term bottom and possible short covering in Sugar after a 9 Sequential Print. We have had a bullish flip (new 1 sell set-up) in the opposite direction, so buy above high of that bar with target at TDSL
We have a perfect set-up short on SPX/SPY with a DeMark Sequential 9 and 13 print with another 9 sell-setup within the 13 count. I would expect this market to fall if we breach 2600 and target at least 1990 in the first instance. Sell below 2533 which is the low of the first opposing No1 bar count (or bearish flip).
We have a smaller 5 wave structure within a larger 5 wave, currently on wave 5 and with a DeMark Sequential 9 bar on the monthly in progress. If the month close leaves the 9 in place I would sell aggressively on the break of the low circa 66.50


