Blue lines recent daily support. Dashed lines historic daily support. Put some time pressure on myself here not to over analyse. Just for fun but ultimately would have responsible risk management at key levels. Absolutely not accurate if specification should require technical. A rough idea. I like it.
Breakout from wedge length a possible and probable target for X to A. Anything possible but it is what it is until otherwise.
A falling wedge occurs between two downwardly sloping levels. In this case the line of resistance is steeper than the support. A falling wedge is usually indicative that an asset’s price will rise and break through the level of resistance, as shown in the example below. www.ig.com Perfect bottom of the wedge which coincided with a daily support, a likely and...
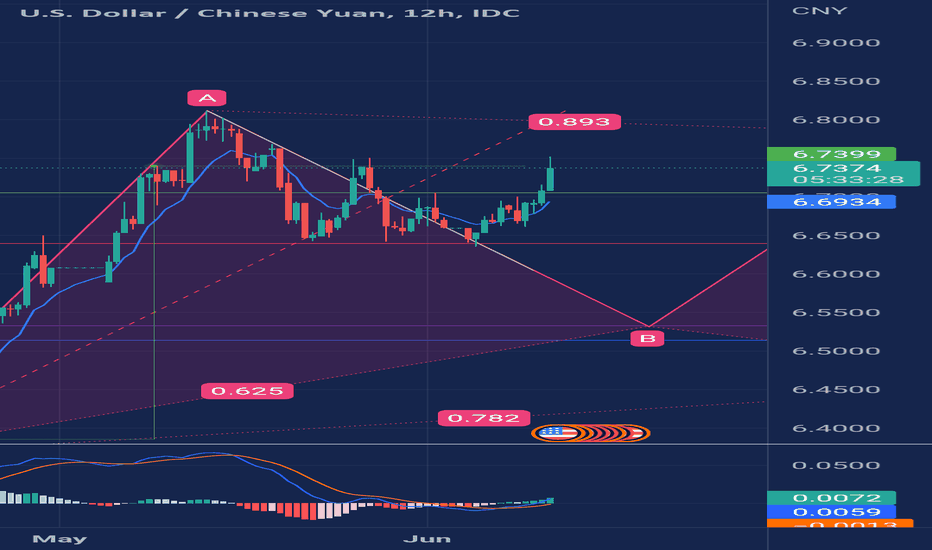
Possible forming Bearish Gartley Harmonic on the short term time frame and period. Fibs line up but admittedly a lot of volume above to break through above. A move to the top possibly the top of the range.
Regardless of all other prices.... See if this pattern without noise plays out. Experimental. Dont forget, there's a BTC ETH pair. This price move is totally at the moment based of the FTSE.
Non bias, a possible descending triangle forming. Take care to know your support and resistance levels.
I love technical analysis. One of the "things" for lack of better word is my attempts to determine the probability of a pattern forming before it happens. To use as a guide. Hand in hand are monthly, weekly and daily levels of support and resistance. Identifying similarities in what ever asset, not over thinking and having a bias and adapting to changes. One of...
Always hearing about Gold, my technical analysis. At first glance, Bearish Gartley. I've annotated my thoughts in text boxes. Interesting (This ones for Yev) :) <3
Current ETH support and resistance after a possible trend reversal. Support 1,200 with resistance at daily Naked POC 1,460. Better a steady rise, quicker the rise the more probability to fall. Ultimate support at 1115. Recommended risk management at and below 1,200 accordingly. Courtesy of daily ETHUSDT Binance using ExoCharts.
Interesting to spot negative divergence although excess upside buying driving the price higher. Will the price lose the daily (blue line) and break the trend to the downside? Interesting
Although the price is slipping down the slippery slope. Divergence on the MCAD says otherwise. Interesting to see the opening price today.
Nice trend reversal surpassing a daily resistance (1st blue line from bottom) into daily resistance (2nd blue line above price). Interesting to see if we can hold.
Falling wedge including current daily resistance levels. Weekly and Monthly support areas. Daily blue. Weekly yellow. Monthly purple. Looking at a probable buy on the monthly. Flipping resistance on the dailys may provide good trading opportunities to the upside.
Enjoying drawing the technicals on Harmonic patterns. Possibility in excess, a little over extended on USDTJPY at current. Looking at 1.41 C pullback to D .78. See how this plays out Bullish Cypher Harmonic.
Eye on a possible double top forming on the 12 hour. A drop below the neckline may be a probability to fulfill a possible Bullish Gartley Harmonic.
Bullish Gartley Harmonic idea on a Daily time frame extending from 09 October 2020 to June 2022. Courtesy of Investopedia www.investopedia.com
Possible that the initial Bullish Gartley Harmonic formation did not complete at point D. Redrawn the fib retracement from point B to C to get the retracement level for D at 1.618. Courtesy of Investopedia www.investopedia.com


