CSIQ looks to have nice gains ahead of it. My personal target would be about $30 ( check the monthly going back to June of 2008) However, I would not buy here, but instead wait for a pull back to the green support line near $21 ~ $22. Another low floater (45M 5% short)
FLGT definitely has my attention, although not at these levels. An entry near the 50 day MA (light blue line) seems more appropriate. Super low floater (11M outstanding, 8% short) really has my attention.
My initial thoughts on $CHRS were bullish,, but the 28% short on this low floater has dampened my bullish zeal. With a $10 range from peak to trough of this pattern, it could go big either way. Green trendline = long. Red trendline= short. Do your own due diligence!!!
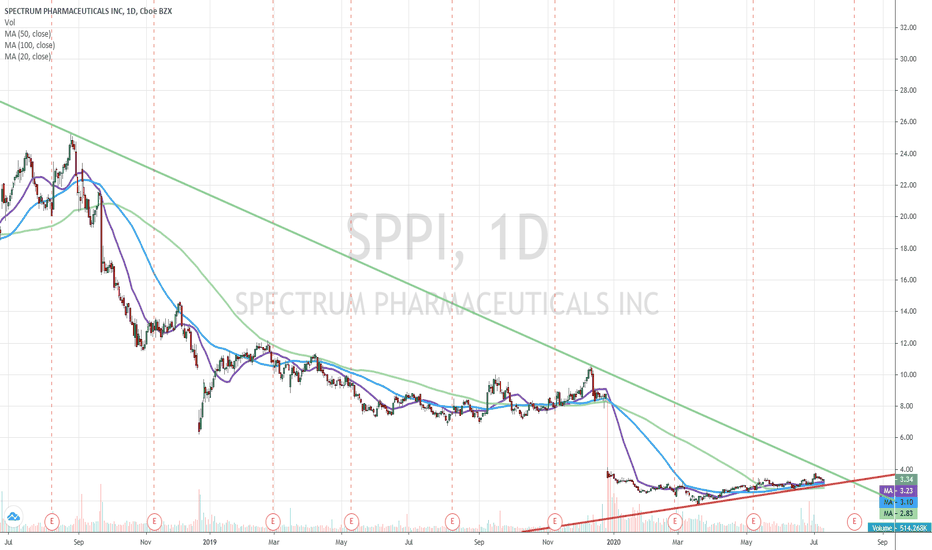
The upper trend line on SPPI goes back to when it was over $23. There could be huge upside for this pharmaceutical....... or it could go to zero. Do your due diligence. Almost 6% short.
Not sure if ARLO has the momentum to break thru the green price level. This low floater(74M) may need 1 more pullback before breaking thru. Stop is the red line
This chart should resolve VERY soon. Green trend line is the trigger to go long. Red line is the trigger to go short . Low floater (69M oustanding, 5.8% short )
Fairly straight forward setup. Narrow range plus the 50-day MA coming up to add support to the rising red trend line. 48M float. Insiders own 62% of shares. I would be looking for at least $28.00 after the breakout.
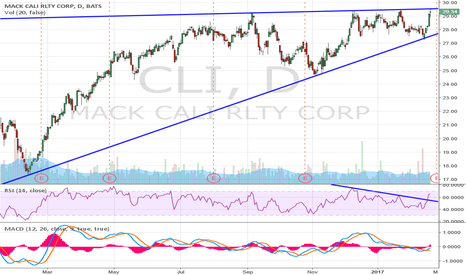
Too pretty of a chart not to share. Clear ascending triangle with breakout already in RSI and MACD turning up. I'm not a fan of today's candle, however. But the stop target is only 4% lower around 28 . 80M float and 6% short. 96% Inst. owned. Definitely one to keep on the watchlist. 34-ish target
$CL looks to be bottoming. A nice triangle pattern. The thing that I find weird is that there are two abandoned babies sitting next to each other. I mean where are the parents??? I think that makes it extra bullish as soon as it crosses $66.60 ish area
With the $VIX at these low levels, its possible that it could rise from here. But keeping an open mind, (with SPX making new highs) , I feel it is entirely possible that it could fall to lows of around 8-ish
Well this kinda seems like a lay-up. If WAC gets over 6.05, it should hit 7.00, as 'gaps get filled'
CHK appears to be in a down channel, but looks to be trying to break out of this channel. If this bull flag pattern plays out, I would expect to see CHK at the heavy blue line at $8.50 , possibly to $9.50. The first hurdle is at the smaller blue line at ~6.65
Climbing stochastics and relative strength suggest that DLB could probably break thru the green trend line. This stock has 9.66% of the float short (short ratio 10.48) , which I feel could propel the stock to recent highs(~$45.00 +)
It appears to me that $QTWW has fallen to far outside of the lower Bollinger Band(@4.86) and is starting to make its way back up. They do have earnings Tuesday after the bell. Their recent agreement with Ryder should help their earnings. My immediate target would be the blue or red trend line. Also keep in mind that magenta trend line way above.
It would appear that since $FTR has broken the blue down trendline, the next likely target should be the upper green line of the channel.(>8.00)
Depending on how you look at trend lines, we have either broken thru a long term down trendline or are about to do so. In either case, $PWE is a stock to keep on your watch list
The point of reference for the blue line is 9/3/2001
$ORAN appears to be breaking thru and looks good on daily/weekly/monthly timeframes


