johninvest17
PlusTopped on a green 9. We are on red 1 right now and if we get a red 2 below the red 1 on Monday. It is a good shorting opportunity. The RSI, MACD, and CMF are showing the bulls are running out of energy. I am bullish on Qantas long term and therefore I am expecting the bulls to take back control on the trendline or near the moving averages.
Breaking out today or this week? Price level to watch $98.18
Energy Sector XEJ looking good. Whitehaven Coal looking good too. From a TA point of view: Broken downward trendline RSI and MACD rising I like it even more once the stock price can close above the 50 MA. Keep it on your watchlist!
Breaking out this week? Indicators are turning bullish.
The RSI gave us a Divergence "a warning signal" on the monthly chart. Today sell-off of 2.19% was going to happen anyway. Maybe more to come if the US Market continues to sell-off. I am still bullish long term and have added support lines on where I expect the price to bounce back. ---- Related ideas Nov 30 TD Sequential is showing a Green 9. This could be...
Is this the bottom for Beyond Meat? Is It Time to Buy into the Beyond Meat Hype? Weekly red 9 with a green 1 over the red 9. MACD is bullish on the 2D. RSI trending up. I will add to my watchlist.
$MCD McDonalds approaching trendline support and 200 MA. Worth watching for market sentiment, long or short play.
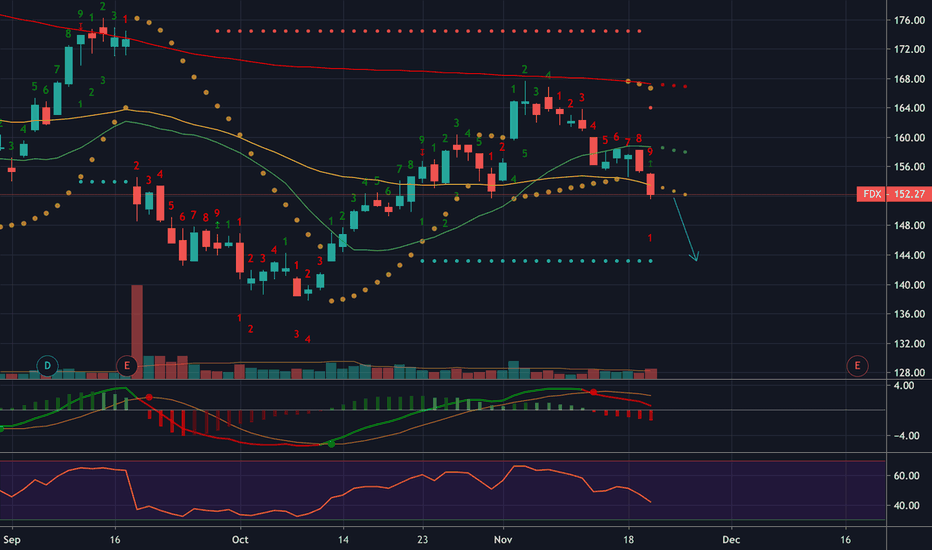
The stock price is below all moving averages, MACD, SAR, and RSI are still bearish. Head and shoulders pattern. Trade the trend. The trend is your friend. Short FDX.
Is Gold getting back inside the triangle or get reject at resistance and continue to go lower? We are likely to see a trade deal phase 1 complete and signed very soon and the indictors I use are showing the bears are still in control. We are more likely to go lower, but Donald Trump can change all this with 1 tweet!
The TTM Squeeze indicator attempts to identify periods of consolidation in a market. ... The dots across the zero line of the TTM Squeeze indicator will turn RED, signifying this period market compression. So breakout or a sell off next week for $XJO? hmmm, we are close to a breakout or a double top...MACD and RSI are looking bullish at the moment.
Bitcoin to go down further before breaking out to ATH?! By using the "Elder impulse System, we normally would need at least 1 or 2 red bars of "big drops" before Bitcoin will breakout from the falling wedge.
QAU failed to close above the channel a few months ago and now looking more bearish. OBV, RSI, MACD, and volume are bearish for QAU. We could see more downside in the midterm.
Is ST BARBARA LIMITED showing a double bottom? It could be a good buying opportunity next week if Gold Prices continues to go higher.
TD Sequential showing a green 9 and stock price is also close to fib resistance level.
Trade the trend, "the trend is your friend". All three indicators MACD, RSI and CMF are pointing downwards which tells me this stock can break the support line. Thus, going down fast! We could go as low as 85 cents at this stage. A good buying opportunity coming soon. I will keep it on my watchlist.
TD Sequential showing a Green 9 and Stoch RSI are turning bearish for Google. Selling volume is starting to build momentum while buying volume are slowing down. Which tells me the bears are getting the upper hand over the bulls. We have gone up for a few days now, maybe a short term pullback is due tomorrow or this week.
TD Sequential showing a Green 9 and Stoch RSI are turning bearish for SPY. Selling volume is greater than buying volume indicating the bears are getting the upper hand. We have gone up for a few days now, maybe a short term pullback is due today or this week.


