khaledabdrabo
After we saw the long correction we were waiting for same as I mentioned in my previous chart, it's time to go back to test the resistance at 0.01997 I expect that we will break through this second time, and we will be going to the red line Fibonacci 0.0248 and of course will be a correction from that point down to 0.020 then I will be posting a new chart...
As a daily chart, we almost breaking out from the trend line, but we are not confirmed the break through yet unless we breakout that resistance at 0.018 if that breakout happen, we then confirmed we going to see a very nice bull run until December 2025, expected price to reach 0.03 I hope the it make sense, thanks for following me and supporting my charts, every...
we may see Big correction same as old scenario, simple chart for 1h chart RSI over bought, and we may see a long correction, unless we have a strong support that keep us moving upwards
I think you need to imagine the monthly chart, however it is all time high trend, but I think the BTC will need to go crash again to the $69 NYSE:K , since the RSI is over bought, and the Vwap is far from the actual price, the price needs to go touch the Vwap sooner or later, just remember that. then we will see $140K
if you look to the VWAP indicator (white line), it is around $37K, that is the average of the price shouold be at, While the price right now at 88K, we can't go above any further, the price much go down to meet with the VWAP line, we are ahead of another crash before we see BTC going to the $150K so be aware of the coming crash, very soon.
I can tell from the trend line that we are still in a down trend, once we pass thorugh the trend line, we can see a nice bullrun
📊 Fibonacci Levels: 100% Fib extension (~$74,146): Currently acting as a key resistance — price is reacting to it. 127.20% ($93,137) and 141.4% ($103,051): Next major resistance zones — likely targets if the uptrend continues. 161.8% ($117,259): A very bullish projection, and possibly the top of Wave (5). These are classic take-profit levels for longer-term...
Dollar Weakness: Tariffs could undermine the U.S. dollar’s global dominance as trading partners seek alternatives. Analysts like Zach Pandl from Grayscale argue this creates “space for competitors like Bitcoin,” potentially driving its adoption as a hedge against a weakening dollar. If inflation spikes and the Fed pivots to looser policy (e.g., rate cuts), BTC...
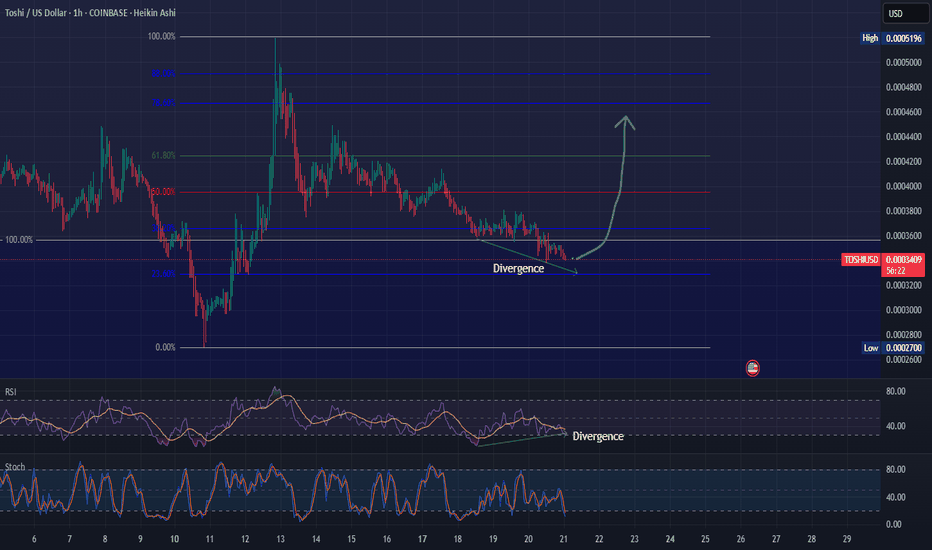
The chart just show a hidden divergence, we excpect a good bullish status, get ready
If we break through the 76K, we will test the support at 70k - 73K however we reach to the 70K, we still on the mid up trend line, and over the main up trend line. so, in the long term we are bullish anyway. I have nothing else to say for now. I hope my chart is easy for you to understand it.
Hello all traders, I know this is not a professional analysis, but it's just my simple chart with Fib tool and trend line. since year 2020 we are on the up trend til 2025, since then we never break through the main trend line, and I don't think we will see the price going under that main up trend line. crypto curruncies since started and it is over the main up...
As a fib tool with the main trend line, we can see that the price is already touch the main trend line, we have a big chance for bounce back after droping from 3,920 blue line average on fib tool, if the price break through the main trend line, then we are going to see a price drop to the next support level at 1,550 but all indicators shows a 90% a chance for bullish
The price meeting the support at 98000, where we can see the divergence spotted with the RSI decline lows and the BTC price lows increase. sign for buy long for the 4H chart, daily Chart, price is going down.
I am not perfect on explaining what is happening, but I am good in drawing my expectation. in this expectation, I think there is a signal for Divergence from the tops which indicate price will revert to hard down, so keep in mind, Selling short period is about to happen. and put in your mind, that the price sooner or later will come back to the main trend link (...
A very nice Divergence here for Bullish move using RSI lows and the trend lows, you can determine there is a divergence for the price to go opposite :)
My expectation went 100% accurate :D enjoy your profits who followed my previous analysis :)
This is a simple Fib Daily chart analysis showing you the next price BTC 127.20% = $81,847 141.40% = $90,528 161.80% = $103,000 Some of you maybe see this is not going to happen, but I am telling you since Trump won the election, The BTC market will hit the $138,000 some day in the future, don't lose hope, and trade with patience, patience is the key.
This is a simple Fib weekly chart analysis showing you the next price BTC 127.20% = $82,370 141.40% = $91,135 161.80% = $103,728 Some of you maybe see this is not going to happen, but I am telling you since Trump won the election, The BTC will hit the green peak candle at $138,000K that candle is a sign to show people that BTC will reach this price oneday,...


