WHA : Long Position after new high 200 bars I aim to open long position at 4.40 price
SAWAD inverted H&S marked up 10THB and hope this breakout results at least 10THB mark up as previous.
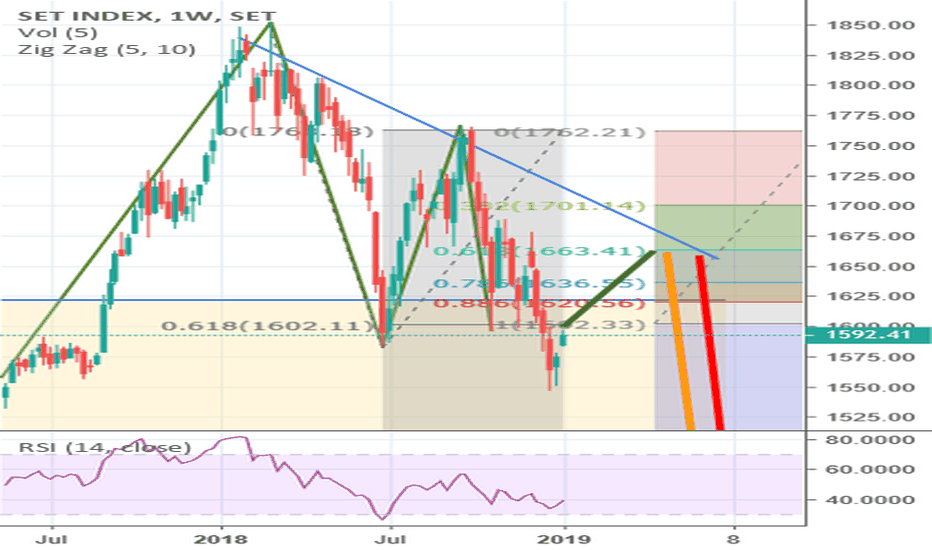
After SET index breakout 5 years channel at 1600.00, it retested to 1600.00 support line and showed the weakness breakout as long red and short green candles. It dipped a little new low at 1590.00 so this notices the bearish sign of lower high and lower low. Forecast : Bounce to 16500.00 and plummet to 1500.00/1350.00
Price pulled back and did the high retest. then I aim to open short position.
THANI : Similar pattern after channel breakout It's likely to gap up and reaching 30% to TP 11.40, though this mark up seems weaker than previous mark up due to the mid channel breakout. Hopefully the same pattern happens.
Trend was likely to be reversal when it shows two higher bottom and 19.0 breakout with peak volume and a gap up afterwards. This is kind of the uptrend confirmation. The target are predicted from the cluster of Fibonacci extension and projection which accidentally equal the peak volume price level in the past months.
Assume selling climax in July 2018 and accumulated for 26 bars. Then it did breakaway gap and marked up(01) for 30% approx. Again, it accumulated for shorter period for 16 bars and later did the breakaway gap which assuming this is in the mark up phase(02). Hopefully, it will reach 30% as a minimum next TP that should not be less that mark up phase(01)....
H&S Pattern breakout with gap is a high demand drive. I found this stock too late so just wait and see the target price with Fibonacci projection. Just wondering the Fibonacci extension is not significant to this price chart.
PTT : Long position after H&S breakout at 53.00 If you either believe the H&S pattern or the resistance breakout with significant volume, you will definitely buy long position for PTT. I buy long position at 53.25 and feel aware of the black swan event in case it happens.
Bias Long to the previous high ta 54.00
High retest at 9.20 with 30MM and 28MM volume which already has a little pullback. For weekly chart, long green candle and tiny red candle shows obviously.


