Ethereum has been in an ascending triangle for months now. I expect a breakout between the 66% and 90% which corresponds to the end of October and the end of March respectively. If we break to the upside, I expect it to climb 3000-3150 USD. If we break to the downside, I expect it to fall to 1000 USD. Statistically, ascending triangles break out to the upside,...
This could be a bit bearish for ETH in the short term, but bullish for a possible big up move in the coming months.
One thing I know for sure is that once this pattern breaks out we'll see some explosive price action. I'm leaning on the bull side right now.
If Bitcoin gets rejected from the 21 daily EMA, it may revisit the lows of a few days ago. If that happens, will we get another change to accumulate more ETH?
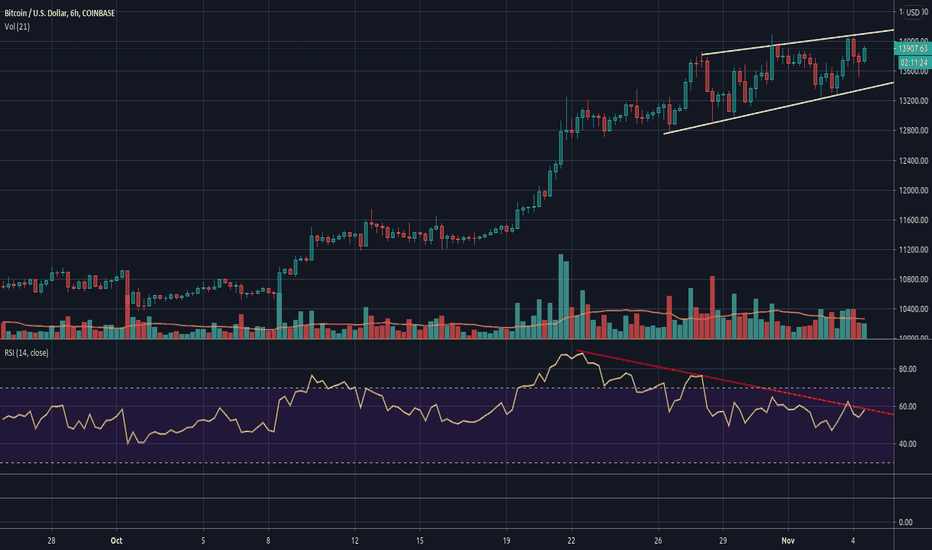
First time we had a daily close above 14,000 USD since a long time, great performance demonstrated by Bitcoin. But apart from that, many bearish signals are lining up on the chart right now, here's another one I just noticed: a rising wedge pattern with gradually declining volume and bearish divergence on the RSI. If you add this to the bearish hash ribbon...
#Bitcoin approaching the previous 2019 high, hash ribbon average getting nearer, elections in 7 days = expect volatility and pullbacks.
Waiting for the weekly candle to close, if it closes above the white line, I expect the price to reach the 13,000 USD - 14,000 USD range within the next month.
This short term downtrend is either going to reverse and the uptrend resumes, or price gets rejected between 10,900 USD and 11,200 USD and gets pushed below 10,000 USD. The ADX indicator (which tells us about the strength of the trend) is telling us the current down trend we've been since August 19 is really weak and could potentially reverse. The fact that...


