orbborisson
This post is a confirmations aggregator for the main idea in questioning: /////////////////////////// I've looked at the indicators and saw... sea calm on 30m...(see the above chart, no confirmations yet) Overbought on 4h: Overbought on daily: ///////////////////////////// As of yet - a few not critical confirmations of the IMMINENT CORRECTION have...
The view from the above. See the very same pattern? It is the expected hard trend breakage. It is already happening! That's why there's so many confusion around. The same pattern, the same conditions, the rally is still on! If we fail then a new WXYZ will form: The failure can be confirmed with the price moving below 7650-7600. Because at 7600 it would become...
56 hours straight (with a few hours offline now and then) are finally paying off. <<<<<<<<<<<<<<<<<<<<<<<<<<<<<< >>>>>>Push the Like Button<<<<<< >>>>>>if agreed,<<<<<<<<<<<<<<< <<<<<<<<<<<<<<<<<<<<<<<<<<<<<< >>>>>>expand in comments<<<<<< >>>>>>if not!<<<<<<<<<<<<<<<<<< <<<<<<<<<<<<<<<<<<<<<<<<<<<<<< I'm off the market for a few days now... ... thus...
Finally the rally price action proved previous forecasts to be true(ish). The question everyone is asking - when does the rally end? I've carefully mapped out all four basic bullish scenarios I can see in this market. We're about to see at least one deep correction model that will retrace 15-40% of the typical 12345 impulse, if it is finished(if so, then bulls...
Yeah. A very strong triple reversed bearish divergence c.A has just kicked in. This is a sign of a great bearish pressure. But a small return fire finally came from the (asian? already? hard to keep up with everything...) markets and we have consumed a lot of the impulse related to this divergence by another small divergence - but this time a reversed bullish...
Always prepare for the worst. This is the mmost bearish scenario I can This is the plan for the battle if a longer correction takes places... And it seems that we are sliding down to 6800. at least 1 group of xyzwxyz corr.waves is coming. Finally we are observing some volume - that is good news!
I carefully pointed out all the important divergences a person can find on this 30m chart. Please notice the chart displaying two correction forms, two twin brothers. Everyone is looking at the differences between these two twin correction movements in order to be able to identify the pattern breakage before it actually happens. I used two RSI with 14 and 56...
Yes, for the past few weeks we have gathered and brainstormed a lot of confusing signals. Neither the bears nor the bulls truly feel save as of this moment, as we are probably on the verge of trend changing or forming a continuous months-long flat. We can safely say, that is not a simple task to forecast the price movements in these conditions! Every newborn...
I Feel if there is Santa Claus it will bounce this price right now... Beutifull bullish pattern is closing and either we will finally see the confirmation pump of the year or play one more dead cat 'till Jan 2020... 1. feel like a buyer around this correction dance. 2. And RSI on 30m is finally oversold and rocketing up. Bulls may give at least one good fight...
Shifting bear every second... Bulls are weak...
Staying bullish. The Europeans didn't drop... yet...
A lot of news coming in, and we have seen some volume , but neither we were dropped nor rocketed. Now the bulls are protecting 7400 pivot - just like on the 5th of Dec 2019. While the market repeats itself(see the chart since 27 Nov 2019), traders are making bets if it will drop again just like on Dec 9 2019. I'm still bullish with the buy positions in, but...
Bulls have been met with powder-loaded bears at 7550 and been running to re-accumulate at 7325-7350. I can see two possible outcomes. The current market situation looks painfully alike the previous few weeks. Bear drop is possible, better keep an eye on the market. Suggested SL for the longs - 7250. TP for shorts - 7150, 6900.
Remember what happened earlier... 1. We have been continuously defending 7200 pivot, and all the shorters in the world couldn't bring us down to 7100! 2. All previous bearish moves, all consisted out of typical correction forms which proves that bears finally lost their power. Bitcoin is now considered cheap if it is sold at 7200. 3. We have been experiencing a...
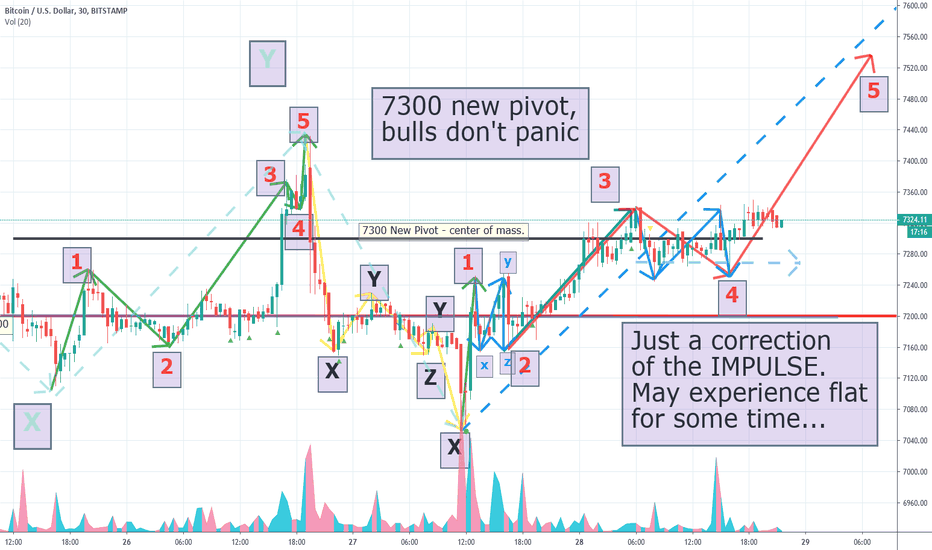
Flatting around 7300 pivot - the sign of the mass shifting up. No more 6500 anymore, ever. Maybe just a small dump to 6800-6900, then rocket up without any hesitation. Epic bull run is in hours...
Moving further up. Its a small correction and a possible flat around 7267-7325. Bull all the way.
No need to say even a single word. The chart is screaming.


