ASX:PGC Paragon Healthcare seems to be gaining traction and has a slight pull back recently but I would still wait for a clearer signal to enter. A nice cup and handle has been formed and i am waiting for the RSI to cross the 50 mark with conviction before entering. That will also mean I prefer to enter after the prices cross back into the main channel at $0.855...
RSI is already touching the oversold boundaries. How much further can ASX:APT run? For early investors, you might want to book some profits soon. I wouldn't recommend going into a trade right now with ASX:APT because of the limited upside to my target at $10.30-60 before a correction is due.
ASX:KGN Double top formed. Should there be another leg down, target the 2 support areas for shorts. Stop-loss @ $7.46.
BINANCE:BTCUSDT My thoughts are on the chart itself for today and tomorrow.
NYSE:ACCO is looking good on the Daily and Weekly. Prices are above the cloud and the TK just crossing above cloud (see highlighted green box) indicates a bullish move in the coming weeks. I have indicated two target levels to watch out. The nearest term target 1 at $14.45, and if cleared, target 2 at $16.15. RSI is fast approaching oversold territory and money...
BBX is facing a lot of resistance at $9.12. There's a lot of buying interests at this level. The volume is increasing however the CMF has yet to turn up positive. If we can manage to break the $9.12 resistance with conviction, we should be able to see BBX return to the All Time High at about $10.96. We can see that the prices have fallen below the Standard...
Declining volume on the OBV. CMF currently neutral... not showing any strong positive signs. The stoch. RSI is oversold and if we see a reprieve soon, prices should find support at about $6100 for the rest of the weekend. Enjoy.
ASX:PLS We are pounding on the support line $0.865 the third time. I am not confident that this support will hold, look for support around $0.81. The TK cross last week above the clouds was a sign of an incoming bearish signal albeit a weak one. Yet the prices continue to fall and refused to close above the clouds for 2 consecutive days already. I believe that...
ASX:IMU Double top testing neckline. A close below the neckline this week spells trouble. Look for support at 0.017.
Ichimoku is still painting a gloomy picture. The daily stochastic RSI is starting to turn south. Chaikin Money Flow is still showing negative/neutral selling pressure. Volume is also sloping down to being flat. Looking at historical supports and resistances are our best bet now to -k-n-o-w-i-n-g- guessing where the market is going. If we do not break the next...
SGX:Z74 Singtel is currently in a falling channel. If you are keen to short, ATH to ATL Fib retracements at 0.618 and 0.768 targets highlighted in green boxes. We might have a slight bounce at $3.04 and if so, target between $3.17 to $3.25.
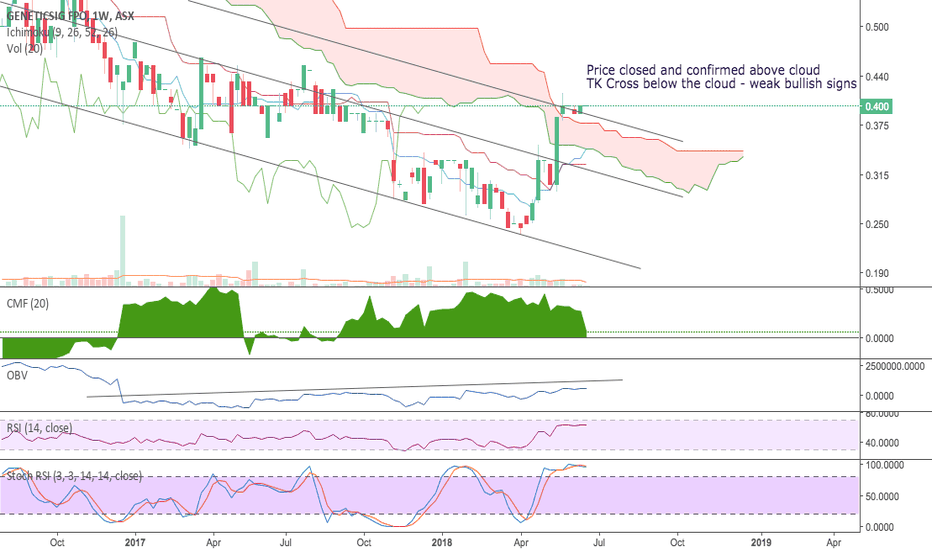
On the weekly note, We have a weak bullish TK cross, prices have closed above the cloud which is a good sign that the current support at $0.38 holds. Currently it is a long term hold if you are looking into buying $GSS. Short term outlook: RSI is hovering close to oversold conditions, Chaikin Money Flow is dropping and that means the buying power is weakening....
On the weekly, $AAL has fallen out of the channel. Currently I have 2 support levels that might hold. The head and shoulders might also be at play now. Most likely the lower level will be hit.
Qantas ASX:QAN has been quite stable and experiencing low volatility for the past few weeks. The bollinger band seems to be squeezing as a result. A squeeze means a swing in the price is coming. We have to break out of the ascending triangle otherwise, we are not going anywhere. Wait for breakout and confirmation. Price has to close above $6.45 on the...
Ramsay Healthcare is currently in a falling channel . Is it time to buy? After today's capitulation, we are already at the bottom of the channel and also the completion of the Head. Are we seeing a right shoulder forming in the weeks to come? If we do not fall off the channel, we should bounce and target $68. Otherwise we break support and drops to next support...
My bearish target at 71xx was hit. About $40 off target and that's because of my more conservative style. The coming week is going to be critical. If we break down of the symmetrical triangle, my target is $5850. Chart is invalidated if we break above 8100. CMF and OBV are showing bearish and unless one of them starts pointing north, I am more bearish than bullish now.
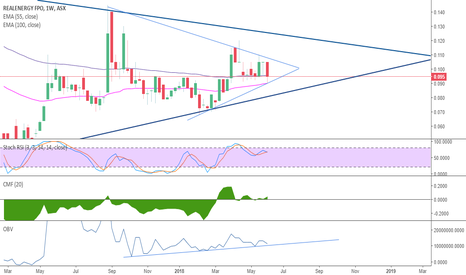
Real energy is still cruising steadily inside the channel. CMF shows that the market is pretty balanced for now. OBV is coming down a bit but as long as we don't break south in the gentle uptrend, we should be fine. Prices are supported by the 55 and 100 EMA. I do hope that the 55 EMA catches up and cross the 100 EMA for a stronger uptrend. However, the...
It seems like bulls have refused to push above and beyond 0.95. Bears are winning for now. The coming week, I expect a pullback to the 55 EMA highlighted in grey box. If hell breaks lose, we will go down to the 100 day EMA also highlighted in grey box. My weekly indicators are bearish and unless we break above 0.95, my bearish outlook remains. Chart will be...


