I had placed a KAGI chart some days back, and that showed quite an oversold status. The regression analysis, as well shows we are in an oversold state, but not very extreme, but reasonable enough, and we are trading at the lower end of the channel. Strategy unchanged view, and BUY current or add to LONG positions @ 102.00-102.35 and take profit @ 105.17 for now.
GER40 has been strongly moving higher, and with some minor corrections in between. We broke up nicely above the ascending wedge, but think we may have seen the highs of it now. We are trading above regression channel as well, and this means we should see a sharp down move to test 21,168 again. Strategy SELL current 23,000-23,350 and take profit near 21,350 for now.
We are very oversold and judging regression channel, wedge and fisher form, clearly we should see a reasonable correction in the near-term. Strategy BUY current 102.80-103.10 and take profit near 105.75 for now. (think it can stretch towards 106.25 even).
This chart is useful for trend analysis is required. We have seen the lows 18.01s and we recovered strongly again. Line break chart suggest we may see higher levels, including Fisher form assisting the direction as well. Strategy BUY @ 18.1950 - 18.2450 and take profit below 18.4800 area (trend line resistance)
ETH is likely to outperform BTC as more weakness expected on BTC and the cross will like surpass 0.0350 in the coming weeks. Currently we have GANN resistance 0.0277 area. Strategy BUY current 0.0254 - 0.0257 and take profit near 0.0325 for now.
It feels we will settle much lower in the coming sessions ahead. Support current $ 85k and next after $ 83k and then GANN support $ 78k. I think the letter will be tested for a move to $ 65k area. Strategy SELL @ $ 85-90k and take profit near $ 66k for now.
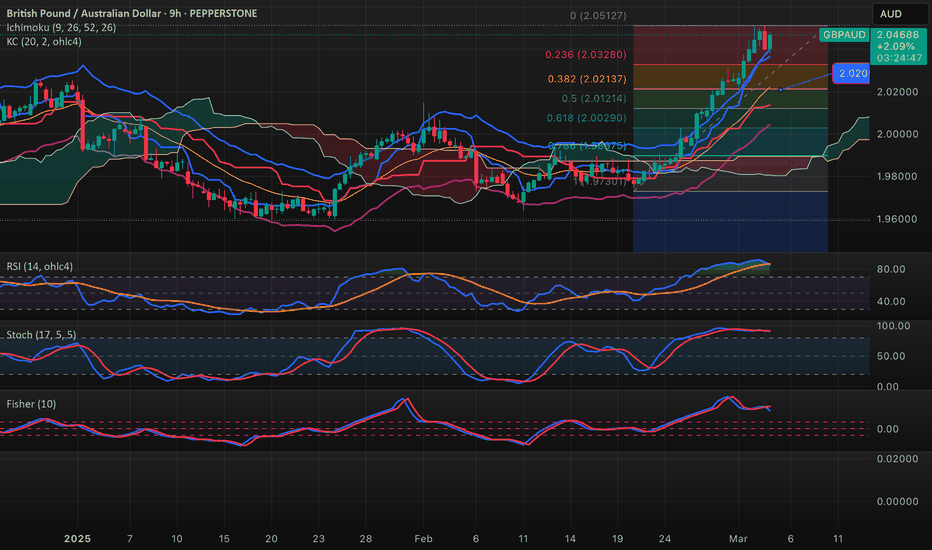
We had some correction back to 2.0287 and fell short of the expected 2.0217. Currently there is upside pressure, and the strategy could be even to BUY into weakness short-term. However, I prefer to focus on overall regression channel, which suggests we should not sustain levels above 2.0550 -2.0600. Strategy SELL @ 2.0550 - 2.0575 and take profit near 2.0217 (still).
It's feels mixed and overbought state has reduced a bit. The pattern currently feels to be a "false bull flag" pattern and usually this indicates lower levels moving towards the based of the pole. Strategy SELL @ 0.8380-0.8400 and take profit near 0.8307 for now.
It feels we may see higher attempt and re-test $ 2,950=2,960 area, but overall I expect a decline back towards $ 2,850 and maybe lower. Strategy SELL @ $ 2,940-2,965 and take profit near $ 2,850 for now.
Think we may have some corrective action up to maximum 18.2750 area I think. We can play the range as we are oversold and likely we will see 18.1050 hold short-term and the pair may range then between that and 18.2750 area. Overall we may see a move lower and test 18.0100. Strategy SELL @ 18.2450 - 18.2750 and take profit near 18.0150 for now. Range play...
The pair went through 18.2900 area and was the catalyst for sharp down move and in line with Kagi chart I shared some days before that we have an overall objective somewhere 17.4500. However, nothing will be a on way street, and we are slightly oversold now. Careful BUY entry may be the way to go today. Strategy BUY @ 18.1150-18.1450 and take profit near 18.2750 area.
The pair is overextended and it feels very much we should correct back towards 0.8328. Stochastic, RSI and fisher form levels suggest we have a reasonable chance seeing this recovery down. Strategy SELL @ 0.8370-0.8390 and take profit @ 0.8332.
It is a wild ride home. It is manipulative asset class, and it is only for the brave. The pattern seems to represent "M" top and neck line is some where $ 95 k. Sometimes we break beyond, and then followed by decline. we are overall negative in trend condition, but fisher form provides positive tone right now. Strategy SELL @ $ 92-97k area and take profit near $ 68.5.
We are in the correction mode, and we should be able to see FIB 2.0217 area for profit taking. Stochastic, fisher form, and RSI all are showing we in SELL mode. Strategy SELL @ 2.0370-2.0400 (or adding to position since we are short at different levels) and take profit near 2.0217 for now. it may go lower, but at least trim or liquidate.
The pressure is still on, and as indicated on the Kagi chart yesterday, I observed the potential for much lower levels due to the possible S/H/S pattern. The regression channel as ample room lower towards 18.0900 area, but the key is how we manage the 18.2900 area (confirmed break or not). we are oversold but not extreme. Strategy BUY @ 18.2750 - 18.3000 area...
I am not very sure, but we may have a Shoulder/Head/Shoulder pattern, which has the head at 19.1300 area, and neckline below around 18.3100. A break (clean one) would mean that our objective could be anywhere 17.4500 area. it sounds interesting, and perhaps this is what is happening overall. Short-term we are under selling pressure still and based on Kagi, we may...
One can observe how well the pair has moved higher within the regression channel. we are near the top-end of the channel now and an overbought state, suggest we should a return mid-regression channel levels around 1.8200 handle. Strategy SELL current levels 1.8450-1.8475 and take profit near 1.8217 for now.
The pair had some minor corrections, but overall we have as yet to see at least near 2.0200 area. the overbought state and stochastic suggest we should see lower in the coming sessions. Strategy SELL @ 2.0440-2.0490 and take profit near 2.0227.


