phoenixwicks9
A potential buying opportunity is emerging as the price breaks out of a descending trendline, fueled by a successful test of daily support and a bullish divergence on the 4-hour chart. The price has been creating higher highs, indicating a shift in momentum. Key levels to watch: 1. Retest of the broken trendline for a potential long entry. 2. Break and retest of...
Given that this pair is in a sustained uptrend, it would be prudent to align trades with the prevailing trend, potentially maximizing opportunities until the trend shows signs of reversal. PS: Note that this is not financial advice. If you choose to act on this information, I strongly advise employing sound risk management strategies to mitigate potential losses.
After an initial rejection from the 4-hour supply zone on April 21st, which lacked conviction, and a successful retest today, I foresee a high likelihood of a price decline to at least 0.819.
Regarding the recent tariff imposed by the US President, this currency pair has been negatively impacted and is expected to continue its downward trend. The price is likely to find support at either the 4-hour demand zone or the daily Order Block, which is located just below. To capitalize on this potential trading opportunity, consider placing a buy stop limit...
A solid low has been established on the 4-hour chart, while the daily resistance remains intact. A retracement to the trend line is anticipated, providing an opportunity for buyers to step in. Bullish Scenario: If price holds above the trend line with substantial buying pressure and volume, EURUSD may extend its rally towards the supply zone around $1.0600,...
Following a strong daily close above the resistance level, a buy-side imbalance and sell-side inefficiency(FVG) have been observed on the 4 hour chart. 1. As long as the price holds above the flipped resistance-turned-support level, the likelihood of a breakout above the trendline increases. 2. A successful breakout could propel the price towards higher...
Ahead of Friday's expected BOJ rate hike (0.25% to 0.50%), USDJPY is at a critical juncture. Technical Insights: 1. Price found support on the 50-day moving average. 2. Lower time frames indicate a bearish bias, following the break of the ascending trend line on the 4-hour chart. Trade Plan: 1. Waiting for price reaction between the 50% and 78.6% Fibonacci...
Price has maintained its position above the daily support level since November 14th, 2024. Key Observations: 1. A buy-side imbalance and sell-side inefficiency(BISI) or Fair Value Gap(FVG) formed on the 4-hour timeframe, indicating strong buying pressure on the daily support level. 2. Price is currently holding above the 4-hour order block, partially mitigating...
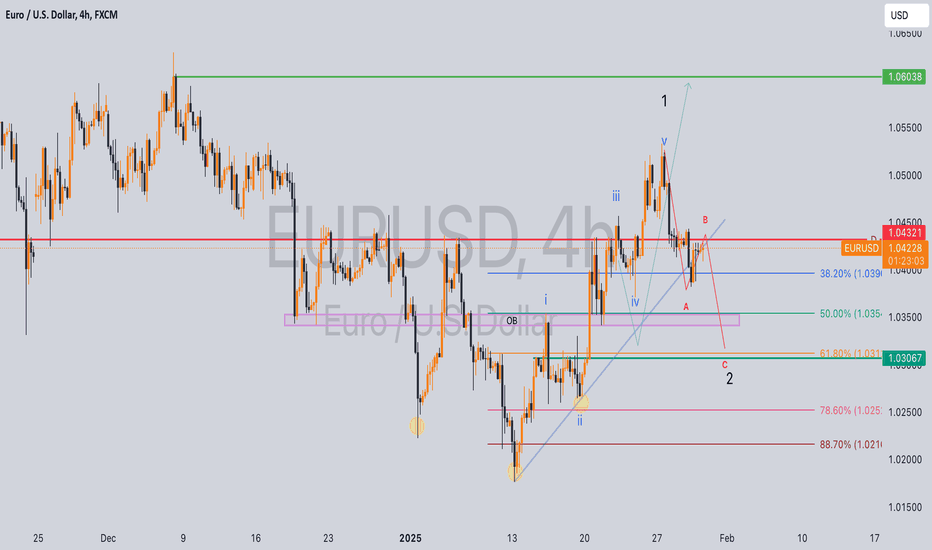
7 days ago, I shared a bullish idea that remains valid despite price failing to hold above 1.04321. Current Market Analysis: Price appears to be forming an Elliot Wave 2 (a-b-c) correction. Key Levels to Watch: - 38.2% Fibonacci retracement level (minimum required for Wave 2) - 88.7% Fibonacci retracement level (maximum allowed for Wave 2 to maintain bullish...
Today's JPY news has sparked a bearish reaction, with price breaking and retesting the trend line on the 1-hour chart. Near-term Outlook: Expecting further downside momentum, targeting the previous month's lows. Key Levels to Watch: - Broken trend line - Previous month's lows PS: This analysis is for educational purposes only and should not be considered...


