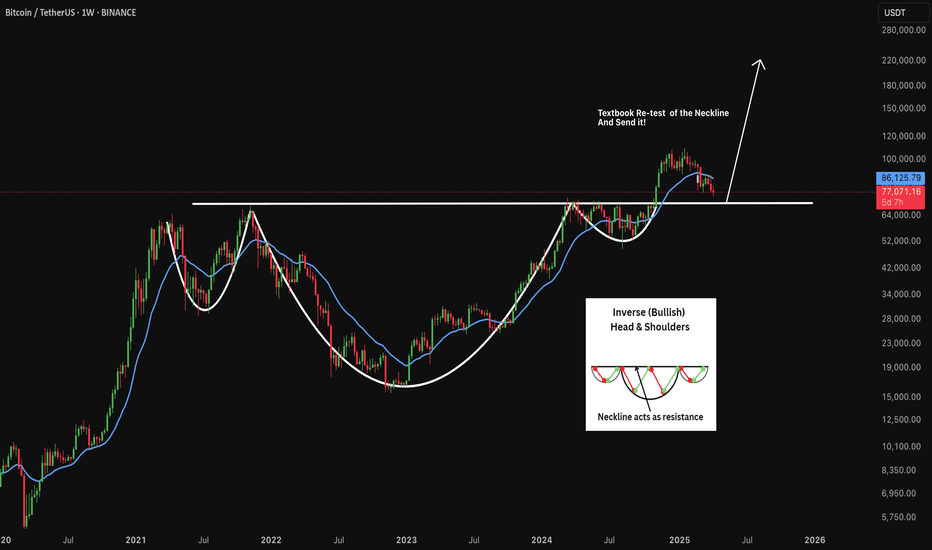
Bitcoin seems poised for a notable shift following the completion of a classic technical setup. The price has recently pushed above a critical level and appears to be testing this threshold again, a move that often hints at further momentum. Should this pattern hold, we might see a robust climb toward higher targets, potentially well beyond current levels. Keep an...
The chart shows XRP/BTC on a logarithmic scale, which helps visualize percentage changes over time. XRP/BTC peaked around early 2018, reaching a value close to 0.0003500 BTC per XRP. This aligns with the crypto market's bull run during that period. After the 2018 peak, XRP/BTC entered a prolonged downtrend, losing 99% of its value relative to Bitcoin by 2025, as...
ANKR/USDT 1D Chart Overview The ANKR/USDT pair on a 1-day timeframe displays a descending trendline extending from its peak in December 2024. The current price stands at 0.020429, reflecting a 1.69% increase. With Bollinger Bands and buy/sell signals in play, the chart suggests a possible short-term bounce near critical support levels. Check the chart for more insights!
VeChain (VET) showing signs of life on the weekly chart. Recently broke above a long-term descending triangle with decent volume, hinting at a potential trend reversal. Price currently at $0.02576, just below the breakout level of $0.02744. Watching for a retest of this level as support-could be a key area for bulls to defend. Next resistance around $0.034003...
Price hitting strong resistance after a steep decline. RSI below 20, showing oversold conditions. VWAP moving up, but money flow needs to step in. Watching for a breakout or rejection—what do you think?


