salsapete
The Euro has seen a sharp Drop following a protracted Base. The Demand Zone below is likely to offer Support and price will react. A bounce is expected as this would be a first touch and Unfilled Buy orders await. Considering a short from the bounce. The suggested trade is on Chart.
GBPCHF expected to make a retracement back towards the Supply Zone. A short trade is suggested , which is in line with the HTF Downtrend. 1. Entry Conditions a. Zone - between the Fibonacci .618 and .786 and up against the 50 EMA. b. Directional Bias - look for MTF alignment of MACD to the downside. c. Momentum - check price has moved to the OB zone of RSI...
WTI peaked in March 2022 around $130 . Since then price has made a Drop - Base - Rally. We are now again in a Drop Phase , with Price estimated to proceed to the Decision Point for the next major Demand Zone at $ 69. Trade is on Chart.
Below is a summary of how I see the Order Flow from the Price High in March 2022. The sequence appears to be Base - Drop - Base - Drop - Rally It appears as though the Rally is a compression of Price. The Decision Point is around $1725. I would look for Gold to make a Fresh Touch for Demand at that level.
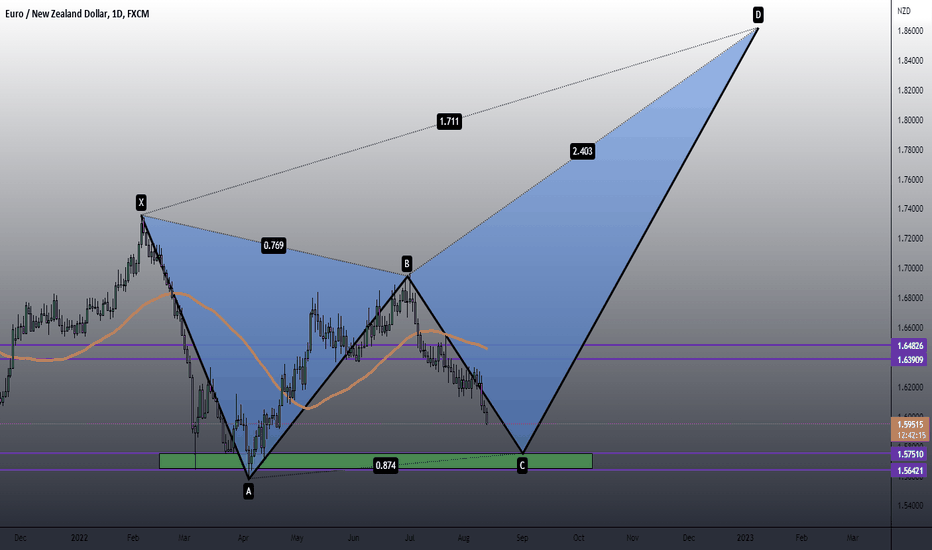
The EURNZD is in the 3rd leg of a Harmonic Pattern - With the B leg completing near the .786 Fibonacci Retracement of XA , two patterns can be considered - Both can find the C leg at .886 Level. a. Butterfly b. Gartley You cannot tell at the moment, price is however looking to test key support at 1.57..... So a short bias is suggested from present price...
This is an idea for the Aussie to form a Shark Harmonic The pattern has completed the X to C legs, and now the D leg is in progress. The longer term price would see the Aussie test structural resistance at .7550.
The Euro is up against resistance 1. Structural - the most recent resistance zone is 1.0360 - 1.0450 2. Dynamic - 50 EMA is containing the daily close. The most recent candlesticks of the PULLBACK are an Inside Pin Bar. We can see long wicks to the upside , indicating selling Pressure. Entry Trigger = There needs to be a large bearish candle form ie....
As per chart.... There is an intraday H&S formed with the GBPUSD. Go short on break of neckline. Target the equal extension....
The AUDUSD has made a pullback high between .70 and .7040. Price has since moved to the downside on the intraday basis. A double top with RSI divergence has seen price test the Monthly S1 pivot. A consideration is to look for a short opportunity which is in line with the HTF downtrend. The trade suggestion is on chart.
On the intraday charts the EURUSD has entered a consolidation of 65 candles. Something is happening here, maybe its distribution. If so, then the Wyckoff Pattern may be pertinent. It appears the Spring has been executed and price moving into a phase to test last resistance before a potential break to the downside. The sentiment on this pair remains bearish ....
On the HTF this pair is in a sideways Channel. Price has moved off the lower Channel Support and appears to be moving back up towards Channel Resistance. The intraday trend is up with 50 MA above the 100 MA. On the intraday chart, price is consolidating within a Flag Pattern. Look for buying pressure and or break to the upside of the intraday flag to go...
GBPUSD has recently bounced off the Monthly S1 Pivot and is testing Monthly Pivot at 1.22. Price is in a Downtrend , and has been for over a year. The next week is particularly interesting as Price abuts 4 structures of Resistance = Kumo Senkou Span A = 50 EMA = Monthly Pivot Point = Major Structural Resistance It is likely also the RSI goes into...
EURCAD has been in a Range Low for the last 16 days. A Possible Corrective Movement may be present next week. REASONS FOR CORRECTION 1. Pattern - Price has made an Equal Double Bottom with 2 important Hammer Candlesticks on the 13 July and 27th July. 2. PIVOTS - Price is overextended and has been supported by the Monthly S3 Pivot. Buyers have not...
Gold is moving back to major structure around $ 1800 level. Price has broken below the Monthly S3 pivot , been rejected , and buyers have taken the precious metal back to the Daily Kijun Sen ( Equilibrium Price for the last 26 candles) . The coming week may see price fluctuate between $ 1753 ( Monthly S2 Pivot) and $ 1805 ( Major Stucture) . With Price...
EURJPY has placed a double top in June 2022. Since then price has tested , pulled back and then broken a major support level. Sentiment is Bearish as price is below both the Kumo Cloud and the 50 EMA. To enter a short trade 1. Entry = in the zone 1.37-1.38 . Confirmation with bearish pressure ie. double top on a lower time frame 1hr or 4 hr. 2. Stop - ...
EURUSD has made 3 white soldiers , a bullish reversal pattern. Look to enter the market around 1.0224 and target 1.0424. Stop below prior bull candle. RR = 1.7
Suggested trade on chart for next phase in Accumulation.
Pound in short term consolidation. The bias is bearish.


