satooshi1242
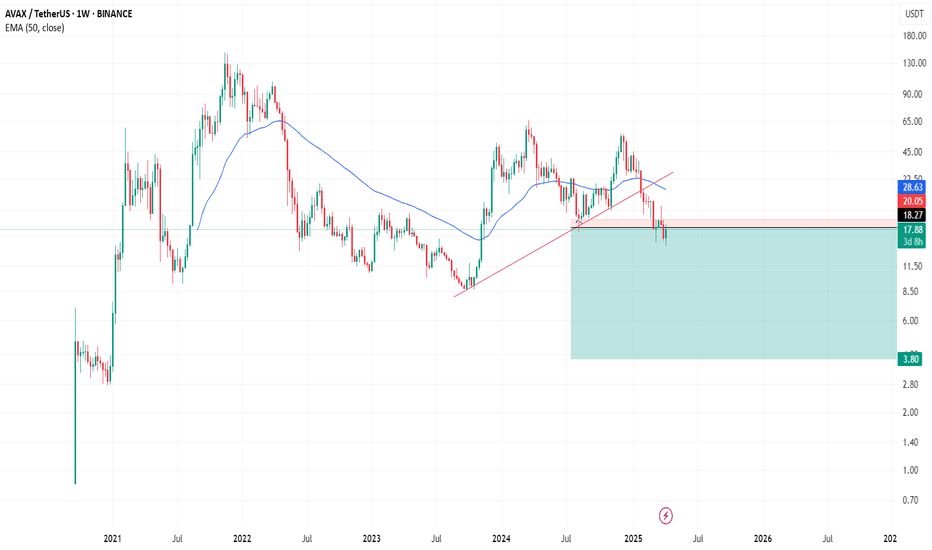
We have broken the trendline and are on track to reach our target price.
As the chart illustrates, a broken trendline with a pullback indicates a potential decline.
It's a signal for a buy position. If the price breaks above the trendline, take a long position.
According to the chart, we have a broken trendline and have reached our target price.
LTC was unable to maintain its support zone and has now reached lower price levels and it continues.
LTC falls by 40 percent . There is a broken trendline and TP must be hit.
JUP hits lower support zone and about 40% is on way .
As the market enters a downtrend, certain cryptocurrencies are likely to experience significant declines.
As illustrated by the chart, BTC has broken down an essential trendline for a downtrend. If the last candle turns red, our prediction will be confirmed for a significant fall.
The chart indicates that the TP must be touched. In my opinion, XAG is better than XAU.
I believe the XAU wants to go lower by $2000, but it depends on breaking trendlines.
As shown in the chart, there is a well-known pattern called Head and Shoulders. The black trendline represents the monthly data.
GRT is showing readiness to touch lower prices. I suggest standing by for long positions in autumn.
I believe ENJ will exit the market after a significant fall, so it's not a good time for long positions.
I believe we may face war in the future, as the market is on the brink of collapse. The essence of war often revolves around economic interests or military power.
Like others, PEPE was unable to maintain the support zone, and lower targets are now on the way.
I believe that DASH will no longer be able to maintain its value if it loses this support zone.
According to the chart USDT.D wants to have a retest . Consider Tp/Sl


