theOUTLANDERer
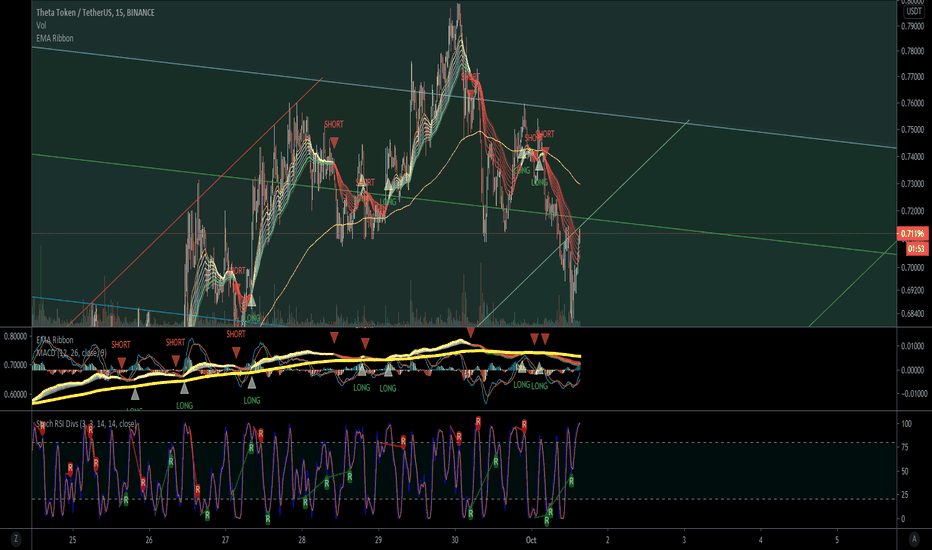
I see Theta breaking a trend and coming down further. Bitcoin may be getting to a point where it is over bought, but a new bull market is definitely happening now.
My chart show Theta bouncing off FIB chart lines. Stoch RSi on weekly is losing price momentum. At the same time we are still potentially going down further.
Everything in the chart is self explanatory.
Stoch RSI is saying that we are crossing over on the weekly and about to come down. The indicator is calling for a sell. We have hit a bottom on the daily at the same time. It could come down to as much as $0.56
Theta is coming down pretty hard bouncing around. An awesome crypto to be trading right now. It is touching my trend lines too, which lets me know of their accuracy and correlation to an overall trend. As you can see we have formed a head and shoulders on the 15 minute. In technical analysis, a head and shoulders pattern describes a specific chart formation that...
Possible price targets to sell chainlink after we had a nice bounce. Chainlink will have a greater pullback after the FOMO and enthusiasm has been exhausted. Look to sell soon.
FIB CIRCLES ARE POINTING TO A MASSIVE MOVE FOR BITCOIN IN THE SHORT TERM. Ultimately Bitcoin looks like it could go as low as $7000. Whatever happens be prepared for a bearish move to the downside before we continue to new ATH.
It is possible for us to continue heading higher; however, a pullback is due for Theta at some point. The 4 hour, daily, and weekly stochastic RSI sends the message that Theta is due for a pullback in the near future. How low will it go though? It may pull back to around .58 to .61 at least before heading higher, but you really never know. This coin has many...
Theta had a descending broadening wedge, which causes us to remain bullish and long for the foreseeable future despite some bearish trends for BTC recently. It seem Theta may be neutral to the trend of BTC and as BTC descends to lower lows Theta continues to move sideways making higher lows and higher highs. We may have just broken above the cup and handle and in...
Fib circle marked short term low to all time high and we just had a breakout to make a new ALL TIME HIGH on THETA. BREAK OUT to ATH as we finish the FIB circle and last ATH. It may still pull back if BTC falls so be careful buying in here. BTC remains in a short term bearish zone and may still fall to the $9000 to $9600 region. BTC still may pull back all the way...
I feel uncomfortable buying breakouts. At some point we need to even out and test the 21 EMA on the weekly.
Possible price targets to for theta price targets using fib channels and circle
We had a bounce from the 0.618 at around $8.50 Possible short on the way down using fib channel price targets if it breaks down from the low to all time high .618 as a FIB RETRACEMENT
Price movement within FIB circles for possible price targets
Possible targets to buy from We hit the 0.618 at $8.56 drawing a FIB retracement from the low to the ALL TIME HIGH
DXY will hit green ring and may bounce off it. If we get above the ring the dollar will be bullish in the short term.


