Daily time frame took a support at the weekly support(Ascending triangle pattern). 4H timeframe the market is in range bound. The range bound has broke out, aggressive traders can consider to enter the marker, conservative traders may wait for the re-test and consider the swing.
Crude oil is in cyclic double bottom pattern. Weekly Time frame :: If a weekly candle closes above the 82.60, can expect a long bullish run of crude oil till 124 USD. Daily Time frame :: In daily you can notice a DB pattern, I have drawn a descending trend line in which there is a short sell possibility for now. But this short is a...
For a daily swing trend, At 4H time frame there was a breakout for inverted H&S & descending triangle pattern. From the CMP the target till the daily resistance, the SL considering the Inverted H&S or Daily support the risk : reward ratio are 1:44 and 1:25 are respectively. Both the risk : reward ratios are good. If my description is confusion please watch the...
At a daily timeframe there is double bottom neckline pattern. if the neckline breaks, the bull in the market will get stronger. The daily and weekly support looks strong. Disclaimer : The CMP is at the monthly strong resistance so trade with tight SL.
The CMP(current market price) is at weekly resistance zone. Below scenarios can happen: 1. Bear :: If a daily candle closes below 82.5920, advisable not to enter the market as the triangle is about to converge leading to triangle breakout & also the Risk: Reward ratio would be small. 2. Bull :: If a weekly closes above 83.2850, this is a ascending triangle...
Daily is in Bull trend, but at 4H time frame the market is in range bound. If a 4H candle closes above 83.1575, then bull will be in control. The risk : reward ratio is 1:2.68 to 1:3.58.
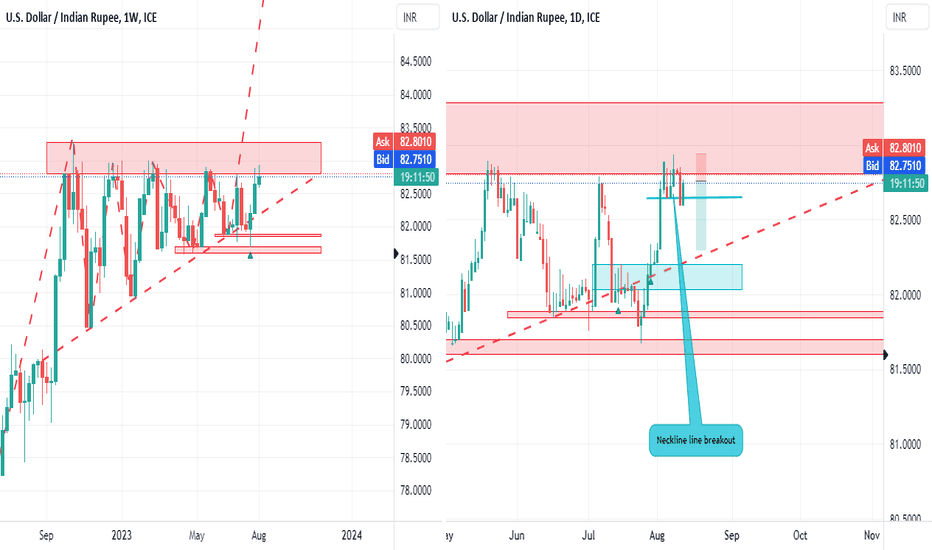
In weekly the market is in Ascending triangle pattern. where the current market price is at weekly resistance. In daily time frame there is change in trend(from bull to bear) formed by double top neckline breakout, so the market is expected to fall further till the weekly ascending trend line(support). After the DT neckline breakout now the market is in retest,...
In this video I have covered the possible move in USDINR, GBPINR, USOIL. If there is any breakout confirmation I'll post the videos again.
CMP is at weekly ascending trendline. Daily there is a bull swing, and 4H a descending triangle pattern(market retest in 4H). If a 4H candle closes above 105.6653 can go for buy. The SL & target level are discussed in the video.
Hi traders, Ascending triangle pattern in Weekly timeframe. The current market is at Weekly support, if a 4H candle closes above 82.1400 can expect a bulls in the market. The risk : reward ratio is 1:3 which is a good trade. Fed meeting is on 26 July 2023, and expected to raise the interest rates by 0.25.
The ascending triangle pattern in a weekly timeframe is still active, last 2 days(24 & 25 July 2023) was a SL hunting. The FED news will impact the INR, making USDINR to be bullish.
4H time frame : Inverted H&S pattern, neckline has broke and the target is 82.8210. This is for a aggressive traders D time frame : Daily candle has to close above the LH level 82.2025 for the conservative traders. Weekly time frame : The Ascending triangle is still valid pattern. Have explained the Protective PUT strategy for those with the lesser capital and...
There is a swing in Daily time frame. The swing is already in move, but not to worry. There is a ample opportunity to trad within the Daily's Resistance and support explained in the video. Once the 4H candle closes above the 106.2834 level, look for the swing or patterns in the any lower time frame from 4H and trade(be bullish) your targets reaches or the daily...
Weekly direction is still indecisive. But in daily there is a formation of Descending triangle pattern. Wait for daily candle to close above 72.63. A small bull run in daily time frame. Target :: 81.66 SL :: 66.86
The gold is still in the control of the BEARS, now it's in the correction rally. If a 4H candle closes below 1910.35, the BEARS will dominate.
1932.14 is a critical level in gold, if a daily candle closes below 1932.14 can expect a strong bears in the market. The market can fall up to 1875.37 after daily candles closes below 1932.14.
There was a descending triangle breakout, we can expect a gold to fall more by 22 $ further. Have explained on how to trade on the descending triangle pattern as well. Please post your suggestion or feedback or doubts in the comments section & and do support on YouTube as well.
hi fellas., The previous descending triangle pattern in 1H time frame SL has hit, which turned out to the DT in daily time frame. Now in daily, if the DT neckline breaks can expect the bears in control to hit level 1890.19.


