Australian Dollar / U.S. Dollar (AUD/USD) 📆 Timeframe: 1-Day (1D) 📈 Technical Breakdown: 1. Sideways Consolidation Zone The price has been consolidating within a clear horizontal range. This range is defined by upper resistance and lower support zones, with several rejections confirming the boundaries. 2. Downtrend Resistance Line Broken A long-standing...
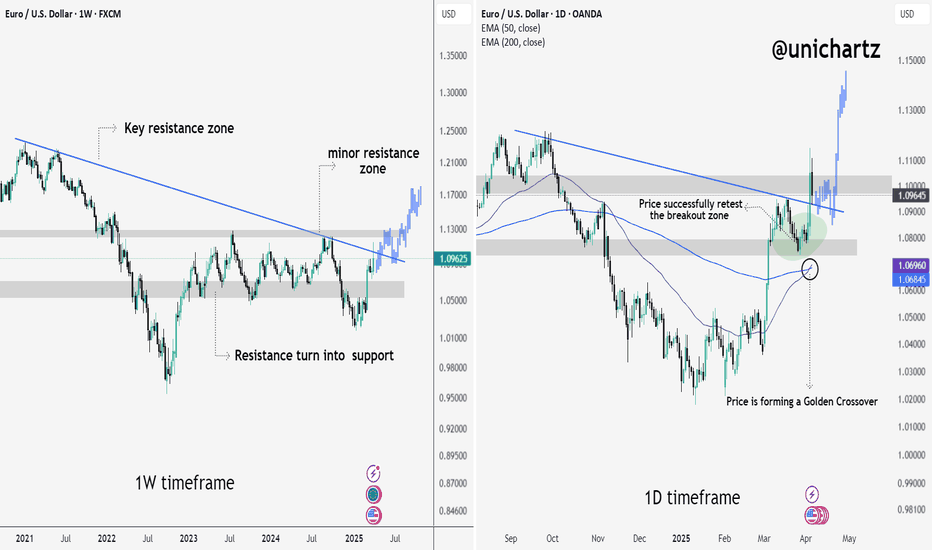
EUR/USD is showing strong bullish signs across both the weekly and daily timeframes, suggesting a potential macro trend reversal in the making. After being trapped below a long-term descending trendline for nearly two years, price has not only broken out but also successfully retested the breakout zone — a key validation for trend continuation. On the daily...
EUR/JPY Weekly Chart Analysis EUR/JPY is holding strong above a rising trendline that’s acted as support since 2022. The pair recently bounced from a key support zone and is now testing a major resistance area. A breakout above this zone could trigger a bullish continuation, while rejection may lead to another pullback toward the trendline. Key Levels: Support:...
USDT.D has broken below the rising support line and is currently testing the grey-marked support zone. If this support fails to hold, we could see a sharp decline toward the mid support/resistance zone. Such a move would likely trigger a strong upside in altcoins as capital rotates out of stablecoins.
CRYPTOCAP:SOL is holding above a key rising trendline that has acted as strong support since 2021. After a successful retest near $95–$100, SOL bounced sharply and is now trading above $120. This move also confirms a reclaim of a previous resistance-turned-support zone. As long as it holds, SOL could aim for $145 and above. DYOR, NFA
ONDO/USDT – 2D Chart Analysis ONDO has broken above a falling trendline while continuing to trade within a broader sideways range. The breakout occurred near the mid S/R zone around $0.90–$0.95, which is now acting as a potential pivot level. The price is attempting to reclaim momentum after a period of lower highs and sideways compression. A sustained move...
SET:BCH is showing a strong bullish reversal from a key ascending trendline on the weekly chart. After retesting the support zone near $250, the price bounced with 9% gains, signaling renewed interest. The structure forms a symmetrical triangle, and BCH is now eyeing resistance near $309. A breakout could target the $440–$540 zone. This move aligns with...
$POPCAT/USDT is forming a falling wedge on the daily chart, a bullish reversal pattern. Price recently bounced from the descending support and is now approaching the minor resistance zone near $0.21. A breakout above the resistance trendline could signal a trend reversal and trigger upside momentum. RSI at 45.93 is rising, supporting the bullish bias....
USDT Dominance is testing strong resistance (5.60%–5.80%) while holding a rising support line. A break below 5.40% could signal a shift to risk-on sentiment, triggering a move into Bitcoin and altcoins. Trump’s 90-day tariff pause may further boost market confidence, reduce demand for stablecoins, and support crypto inflows. If dominance breaks down, it could...
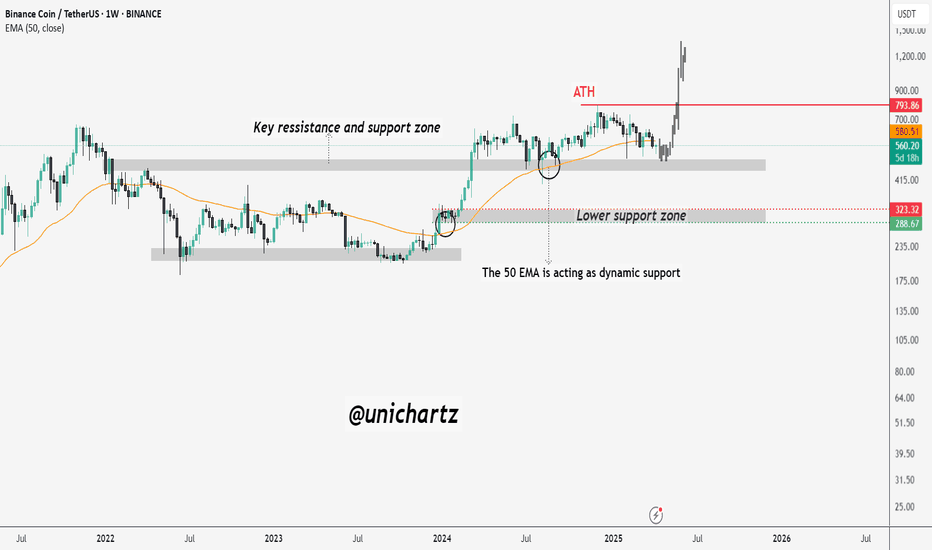
BNB is currently trading near a key support and resistance zone, a historically significant area that has acted as both supply and demand over the past few years. After reaching its all-time high (ATH) near $793, price has been gradually correcting, and is now approaching a critical point. The 50-week EMA (Exponential Moving Average) is acting as dynamic support,...
CRYPTOCAP:LTC is currently trading within a well-defined wide range, bound by a strong support zone near $63 and a resistance zone around $130–$140. The price has once again bounced from a rising support trendline that has held firm since 2020, confirming its significance as a long-term bullish structure. Each time price approached this rising trendline within...
Bitcoin has been forming a series of lower highs and lower lows since its all-time high (ATH) of $109,568, indicating a potential downtrend. The support level, which previously held strong, has now been broken and is acting as resistance. The recent price movement suggests a retest of this broken support, which could confirm further downside if rejected. The 100...
CRYPTOCAP:XRP is currently showing signs of weakness as it continues to drift lower beneath a rounded distribution arc. The price action indicates a potential rounded top pattern, which typically suggests a gradual shift from bullish to bearish sentiment. The asset has broken below the mid S/R zone and is now trading near a crucial strong support area, just...
The NZD/USD pair has broken down from a well-defined rising wedge pattern, signaling a shift in short-to-medium term momentum. After trending within this rising structure for several weeks, price has now decisively violated the lower trendline, confirming a bearish breakout. The move coincides with a sharp rejection near the 200 EMA, which continues to act as...
The U.S. Dollar Index (DXY) has broken down from a Head & Shoulders pattern, confirming a bearish reversal after a successful retest of the neckline. The price is currently near a key support area, and if it fails to hold, a drop toward the lower strong support zone is likely. Additionally, RSI is showing bearish divergence and is below the neutral 50 level,...
The Dow Jones Index has officially broken its rising trendline support, signaling a possible shift in the medium-term trend. After losing this key ascending structure, price is now hovering near the psychological support zone of 40,000, which has historically acted as both resistance and support. This level is crucial. If it holds, we could see a temporary bounce...
Altcoins have taken a heavy hit — many are down 60–80% from their highs. As seen in the USDT Dominance chart, we're still respecting the rising trendline. Until this trend breaks to the downside, pressure on altcoins may continue. Key Zone to Watch: Once USDT.D breaks below that rising support line and sustains a move lower, we could witness a strong recovery...
EURJPY is currently respecting a strong ascending trendline that has acted as dynamic support for several years. Price recently rebounded from both the horizontal support zone and the rising trendline, indicating strong buying interest at this confluence area. Now, the pair is attempting to break above a key resistance zone marked by a descending trendline. A...


