So the previously noted resistance area did not hold, following the release of an "expected news" type RNS. This means we're looking now at the support area that was previously found by the 4th (corrective) subwave. Supporting the cause for positive price action above this point shortly is another small (bullish) falling wedge pattern. However if the level of...
First thing this morning was a back-test of a key support area. Should hold. Needs to hold. The 30-minute Stoch is really looking primed now for a sharp move up. But other indicators should be used to confirm this before entering a trade (if not already in). Volume still healthy.
This came in as a special request (I'm not a holder - yet anyway). And after a big move last week, I agree this is worth a look. The weekly chart has lots of bullish clues in it: Could be entering a 5th Elliott Wave 200 week moving average halted the move of W3 - this is a key line to break, but possibly strong resistance too Indicators looking positive....
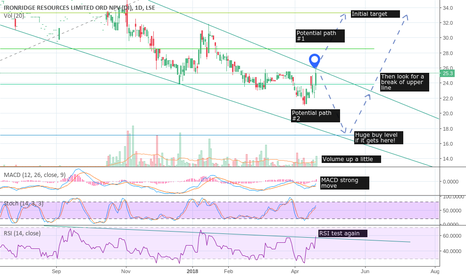
Two positive RNSs in quick succession have given this dormant beast a bit of life. Upper SP and RSI descending trend lines are being tested again - will they hold, or will they break this time? Next day or two should be telling. Two possible paths shown, for same eventual outcome.
Another daily update of the 30 minute Lionsgold chart - not much else I need to say about it really. Yesterday's breakout was as expected, now pausing for a few hours before the next move, slight retrace expected. See annotations on chart for justification/explanation. I remain very confident of target being reached in the near-term.
On the 30 minute chart this is looking primed to surge upwards again after breaking out of its consolidation (falling wedge) pattern. RSI is holding a positive trend, and MACD should cross '0' shortly. Expect big things over the coming day or two.
Here we see a very long, very strong falling wedge pattern. Which is overall bullish. However, it doesn't look quite primed to go just yet (note the low volume on an RNS day!). *However*, opportunities may present in coming weeks: If it does continue to track down to the 78.6% retrace/support line - which is also a historical resistance level - then that could...
As this has been fast-paced since yesterday's surprise RNS, the 15 minute chart seems best to get a handle on what's going on. The 50% gain began to retrace, as you'd expect, and found a previously long-standing diagonal resistance to use as a support bounce. Because it formed a bullish falling wedge it should go up again initially, but then decision time - have...
As expected, the retrace came almost right down to the 78.6% point - in fact it actually obeyed the previous first wave horizontal resistance (now support), staying within the rules of Elliott Wave engagement by not crossing waves 1 and 4 over. The retrace channel resistance broke on the last candle shown and indicators are all positive, so looking like the final...
Just an update from my earlier attempt which keeps the Fib retracement levels (iv) defined by a single Elliott wave (iii). This brings a 78.6% retrace back as a possibility (common on AIM), in which case the main target has now been reduced. But any break of the flag/channel upwards could revise this target if it happens sooner.
This 30 minute chart shows a clear bull retrace flag which is forming following the initial breakout from lows seen recently. What I have shown is an assumed Elliott pattern which to hold true needs to go no further in its retracement than the 61.8% point, or it will risk W(iv) overstepping W(i) - invalidating this setup. As soon as the upper parallel flag...
Following a successful cup-and-handle pattern, it then formed a symmetrical triangle consolidation with dual upper resistance. But in the last day it appears to have just punched through both upper lines on a breakout, which is supported by bullish indicator movements. There should be further upside from this level.
A very clear cup has formed on the daily, having touched resistance of 1.8 again to complete it. IF we now get an angled retrace that fits the shown handle area, AND it breaks up above 1.8 then the target could be around 1.88-1.89. Strategy should be to wait for handle shape to retrace up to 1/3 distance to bottom of cup, break above 1.8 and successful back-test...
Almost at the business end of a triangle pattern, possibly meaning a breakout is imminent. Bullish RSI divergence suggests upwards. Double-line (strong) descending resistance area to punch through first though.
While Strategic Minerals would appear to be a great medium-to-long-term investment choice based on fundamentals alone; shorter-term the chart is forming something very closely resembling a head-and-shoulders pattern. If this completes by dropping below the neckline then it is likely to continue to be bearish in the immediate future to target up to another 1p lower...
Ascent could be about to ascend once more. See notes on chart.
Proxama had confirmation today that Darwin is out. From a TA perspective the timing couldn't have been better as the chart looks like it had already bottomed-out and was in the process of turning. So this event should help underpin the recovery. Overlaying two fib drawings points to an initial target of 0.625-0.64, assuming the strong resistance at around 0.49 is...
Lower lows forming on the hourly chart, yet higher lows on the RSI and Stoch indicators giving us a potential bullish divergence.


