🧱 Wave Structure & Pattern Wave (1)–(5) structure is complete with strong impulse. Wave (5) looks extended with a steep angle — could mean temporary exhaustion before a pullback or sideways correction. Volume surged heavily during Wave (5), suggesting high participation and buying climax potential. ✏️ Key Levels: Current Price: ~1.1394 Support Zone: Around...
A classic range-bound consolidation with a potential breakout setup forming. 🔧 Key Technical Levels: Resistance: Around $3,280 — if price breaks this cleanly, bulls could push for a strong continuation. Immediate Resistance Zone: $3,240–3,245 Support: Around $3,220 (key short-term structure) Pivot Zone: Near $3,200–3,190 — a break below here could signal...
Current Price: 142.868 Recent Trend: Bearish correction from highs above 146.000 📊 Technical Analysis: 🔻 Bearish Structure USD/JPY has been in a clear downtrend over the past few sessions, pulling back from the 146.000 level. Price is currently below the pivot zone (~143.700–144.100) which previously acted as support but now flipped to resistance. 📌 Key...
Current Price: $3,043 Resistance Zone: ~$3,041–$3,045 (major historical level) Indicators: Bollinger Bands (BB 20, 2) 🔍 Key Observations: 1. Major Resistance Hit Price has aggressively rallied to test major resistance (previous support-turned-resistance). There's a sharp rejection or hesitation zone marked by a large red arrow — suggesting a possible reversal or...
📍 Current Price: ~$3,013 🕒 Timeframe: 30-min 🧠 Trade Bias: Bearish Rejection from Resistance
Key Technical Details: Support: Price is resting on the lower trendline of the channel and right above a potential breakout level. Resistance: The upper channel line sits around $85,000, which aligns with the previous rejection zone. Bullish Scenario: If BTC bounces off this level and breaks above the short-term resistance, expect a potential move toward $85K...
📊 Technical Analysis – GBPNZD 🔻 Market Context: Current Price: ~2.2838 The pair has been in a downtrend, forming lower highs and lower lows. Price recently revisited a previous support zone, indicated by the horizontal line and purple box, showing potential for either a reversal or a continuation. 🔍 Key Zones: Support Zone: Around 2.2830 – 2.2800 Price is...
Gold prices experienced a sharp decline today, dropping to a three-and-a-half-week low. The move was driven by a combination of global macroeconomic concerns, investor behavior, and technical market dynamics. 🔍 Key Reasons Behind the Drop: Global Trade Tensions Intensify A major escalation in the U.S.-China trade war rattled markets. The U.S. announced new...
Current Price: $3,148.890 Support Zone: $3,145 - $3,148 (Price has respected this level multiple times.) Resistance Levels: First Target: $3,155 Second Target: $3,165 - $3,170 Demand Zone Holding: The purple zone represents a demand area where buyers are stepping in. Potential Breakout: If price holds above $3,145, it could continue its bullish trend. Sine...
This chart presents a long (buy) trade setup on GBP/USD (British Pound to US Dollar) 30-minute timeframe. Technical Analysis 1. Entry & Stop Loss (SL) 🛑 Entry Zone: 1.29050 - 1.29100 (Purple Support Area) Stop Loss: Below 1.28850 (Red Box) 2. Target Zones 🎯 Target 1: 1.29300 – Minor resistance, suitable for first take-profit (TP1). Target 2: 1.29500 – Stronger...
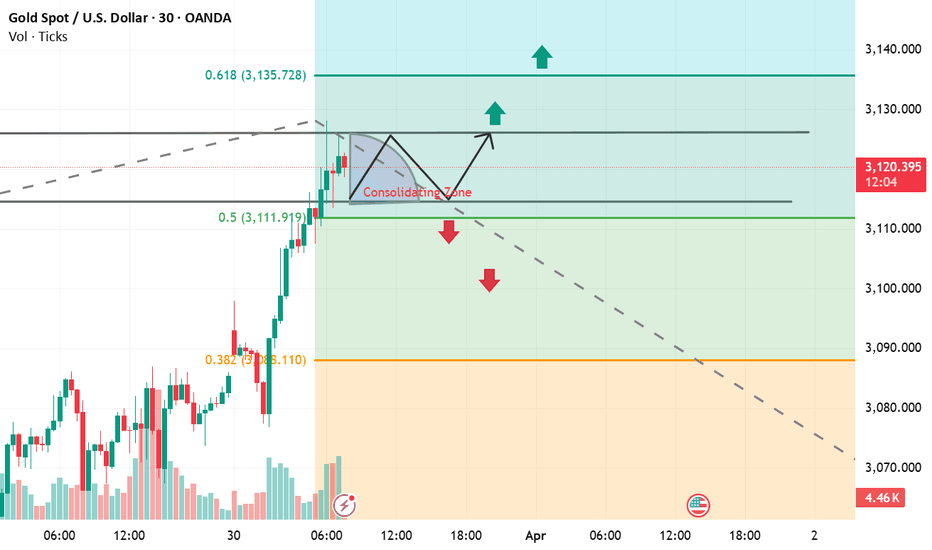
This chart provides a technical analysis of Gold (XAU/USD) price action using Fibonacci levels, consolidation zones, and key support/resistance levels. Key Observations: Price Level & Consolidation Zone The price is currently around $3,119.525, experiencing a consolidation phase (marked in the gray box). The market is indecisive, moving within a range, waiting...
Current Price: Gold is trading around $3,074.31 per ounce, marking a significant rise of 0.6% and reaching a record high of $3,077.44. Technical Analysis Support and Resistance Levels: Support: The psychological level at $3,000 has been a robust support, with prices consistently holding above this mark during recent consolidations. Resistance: The new all-time...
Chart Insights Timeframe: 30-minute chart Current Price: $3,051.595 High: $3,054.630 Low: $3,050.970 Volume: 1.65K ticks Trade Setup Resistance Level (~$3,056): Price spiked up but rejected at this level. Potential reversal point if price fails to break higher. Support Levels: First Support (~$3,048): If price pulls back, this level might hold as...
Chart Insights Timeframe: 30-minute chart Current Price: $3,052.005 High: $3,052.060 Low: $3,039.910 Volume: 8.98K ticks Trade Setup Entry Criteria: A bearish candle formation on the 15-minute chart is required for entry. Direction: Short (Sell) trade setup Stop-Loss (SL): Around $3,053.421 (above resistance zone) Take Profit (TP) Targets: Target 1:...
Gold (XAU/USD) Technical Analysis – March 26, 2025 📊 Current Price: $3,015 📈 Entry Zone: Waiting for a bullish candle confirmation at support 🎯 Target 1: $3,020 🎯 Target 2: $3,027 🛑 Stop Loss: Below $3,009 Analysis Summary: Gold is testing support around $3,015 with a possible bullish reversal. A bullish candle confirmation may indicate a move towards $3,020 and...
Current Price: Gold is trading around $3,015.66 per ounce, reflecting a modest increase of 0.1%. 🔍 Technical Analysis Support and Resistance Levels: Support: The key psychological level at $3,000 has acted as a strong support, with prices stabilizing above this mark after a recent pullback. Resistance: Immediate resistance is observed around $3,040, aligning...
📈 Current Price: $3,024.155 (+0.15%) ⏳ Timeframe: 4H (OANDA) Volume: 27.16K 🔍 Technical Analysis Entry Zone Identified ($3,030) Gold is currently in a critical decision zone at $3,030, marked as the "Entry Zone." If price breaks above this level with strong volume, it could rally towards $3,050–$3,070. Key Resistance: Around $3,070 (previous highs). Potential...
📊 XRP/USDT Analysis – March 24, 2025 🚀 XRP is currently trading at $2.4585, showing a slight increase of +0.79%. The chart highlights a significant zone around the $2.50-$2.70 range, which could determine the next big move. 📈 Key Technical Levels: 🔹 Resistance: $2.70 - A breakout above this level could push XRP towards $2.90-$3.00. 🔹 Support: $2.30 - If XRP fails...


